Features
Fertilizer
Seed & Chemical
Farming lessons with variable rates in MZTRA trials
Good farm science takes time and good weather. At the Manitoba Zero Tillage Research Association (MZTRA) farm north of Brandon, a study on variable rate treatments for nitrogen fertility is going into another year.
The study began with Spring 2009, and results were reasonable, says Earl Silinski, farm manager. However, the study was washed out by weather in 2010 and again last year. Maybe recommendations from the effort will be ready for the research farm’s 20th anniversary in 2013.
Each year, the 640-acre research farm 17 km north of Brandon conducts hundreds of agronomic trials for the farmer members of the research association.
New opportunity
When it was being discussed back in 2008, variable rate applications for fertilizer were a new opportunity for farming. Plumbing and valves for sectional control on application equipment was just hitting the mainstream market, along with software for writing prescription maps.
“We’ve had yield maps here since 2002,” says Silinski. “The guys on our board of directors wanted to find the most effective means of identifying management zones for variable rate nitrogen applications. That was the natural question, could they save money on nitrogen and keep or increase the bushels harvested.”
The farm manager at the time worked with AAFC – Brandon researchers Dr Alan Moulin and Andrew Kopeechuk, and MAFRI provincial crops specialist, John Heard, to set up a design for comparing variable performance at the farm.
They decided to assess how variable rate nitrogen would impact crops in different management zones. They identified six methods for defining a field by performance and applied several in the trial design. These include:
- Landform analysis – classifying the landscape into upper, middle and lower slope positions based on digital elevation data. Fertilizer rates can be tailored to slope position.
- Soil test results - Intensive soil tests, with grid sampling, can guide in delineating management zones. The cost of laboratory analysis is expensive for intensive sampling.
- Satellite / Aerial images – In-season photos from the air or space, both color and near infrared, have become readily available and can be used to aid in defining management zones.
- Soil conductivity – This has been used in the United States to delineate areas with low to high productivity, and in Canada to delineate zones where high salinity reduces crop yield.
- Ground based sensors – A ground-based sensor, such as the Greenseeker, can measure nitrogen deficiency in a growing crop and regulate in-crop application of liquid nitrogen fertilizer.
- Yield maps - Yield map analysis has also been applied to the delineation of management zones, though this approach is not common in Western Canada
Setting up for VR
Trial sites for the variable rate treatments were set up on four fields for 2009 seeding. The sites were a minimum of 120 feet wide through three management zones to accommodate four treatments on each zone. The zones measure up to 700 feet long.
Prescription maps were developed for four levels of fertility in relation to a target yield. The levels amounted to 100 per cent of the recommended nitrogen, 50 per cent, 150 per cent, and zero for an untreated check strip.
Access to historic and current data is crucial to developing a good prescription for a field, he says. The MZTRA did intensive grid soil sampling in the fall, and brought those results into a GIS map. They also overlaid yield maps from several years along with topographic maps, aerial photography and satellite images.
The minimum to prepare for variable rate applications on a family farm, Silinski suggests, is yield data and soil sampling. The soil sampling should be extensive, though not necessarily as intense as the MZTRA requires for research.
As well, a GPS reference point should be taken for each soil plug and kept with the sample for later use. It will be needed for preparing the management zones map and for field history. The best practice is to return to the same sites each year for new samples that will reveal the ‘real’ nutrient picture for crop planning.
At the MZTRA farm, the sampling protocol requires collecting 72 soil samples on each of the 12 trial strips. “That’s somethingly strictly for research purposes; not something to do as a farmer,” he says.
With the aid of a dealership, or agronomist, the family farm can use GIS mapping software to plot the yields and nutrient results onto a single map of the field prior to spring.
Then, a decision is needed for the number of zones that will be drawn across the field. He suggests three zones for the first attempt -- normal, low and high – unless there are special features. The MZTRA has stayed with the original three zones (plus check site) for research.
“Personally, I think the zone boundary should change from year to year because land is always changing. On this farm, it was set up to be static because they need that base line,” he says. “Of course, the whole field gets a new rate map every year based on the crop and the nutrient supply.”
Independent agronomists and various companies will enter the data and prepare the prescription. At first, that’s probably the safest plan – to develop a feel and some understanding of the territory on the office computer.
“A few of our members are interested in doing their own prescriptions. It’s something they can do themselves, after a while. If you have a bit of know-how, you can plug that data into your own software and come up with your own map,” he says.
Questions will arise in doing the prescription. Silinski asks himself, for the lower variable rate area do I want to just maintain the nutrients here or do I want to put something in the bank to build up the soil?
He also wonders about the limits of his equipment and lag time, travelling at 4 MPH or 5.8666 feet per second. It takes a few seconds for a rate change to move from the tank to the furrow. He wonders, should I keep the management zones simple and wide, or is the technology already ahead of me?
The point is, Silinski says, collect all the mapable data you have available for a single field and get it onto one field map, then draw the lines for management zones that will be used by the GPS steering controller on the tractor.
Watch what happens, and learn.
“Our board would like to see the study continue,” he says. “They think there’s more work to be done. Does the technology save you money, cost you money? Is it something you can do yourself on the farm? Can we show it does pay off in fertilizing saving?
“In the first year, the numbers were favorable. It actually was working. We have a bit of fertility left over for 2012, and it didn’t harm anything, so maybe it’s working.”
Four things can be learned from the approach and from their experience to date, Silinski says.
Collect all the field data you can. Try it on a small scale, if you can. Start with a simple prescription. Keep good records, and try again.
May 8, 2012 By John Dietz
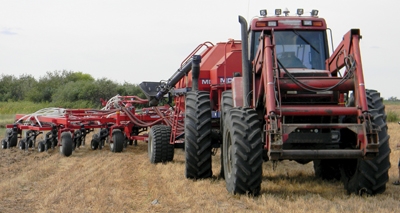 Earl Silinski finishing the winter wheat before a late summer rain at the MZTRA farm. Good farm science takes time and good weather. At the Manitoba Zero Tillage Research Association (MZTRA) farm north of Brandon