Features
Agronomy
Soil
Sensing soil variations
Information on how the soil varies across a field is helpful in determining management zones for variable rate applications of crop inputs. As soil sensor services become more common in Ontario, interest is growing in the use of these sensors to map in-field soil variability. Now, Viacheslav Adamchuk, a precision agriculture engineer from McGill University, is leading a project to compare three different soil sensor systems and to optimize their use for Ontario conditions.
February 12, 2016 By Carolyn King
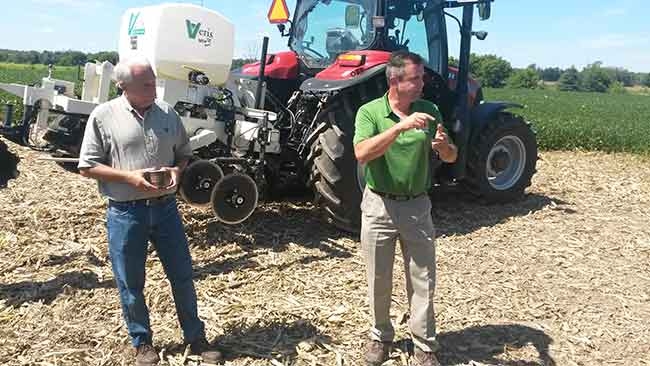 Viacheslav Adamchuk is comparing and optimizing the use of three soil sensor systems Information on how the soil varies across a field is helpful in determining management zones for variable rate applications of crop inputs.
For precision agriculture, a key advantage of these sensor systems is that they usually provide much denser soil information across a field than a county-scale soil map or a traditional grid soil sampling approach. “We have legacy soil maps that were created starting in the 1940s, with the last update in late 1990s to early 2000s. The soils are mapped at a reconnaissance scale that is useful for land-use planning but not necessarily appropriate for site-specific applications,” explains Nicole Rabe, a land resource specialist with the Ontario Ministry of Agriculture, Food and Rural Affairs (OMAFRA).
“Soil sensors like SoilOptix, the Veris MSP3 and Soil Information System are available for use in the province. They can help towards understanding our soils better and map soil at a scale that is more reasonable for precision agriculture applications – variable rate seed, variable rate nutrient management, etcetera.”
“As input costs and land prices increase, variable rate applications help optimize inputs to maximize crop performance on every acre. That led us to a soil sensor tool that can identify the spatial variability on a much finer scale than a traditional soil test,” says Paul Raymer of Practical Precision, a company based in Tavistock, Ont. Practical Precision provides sensor services, including SoilOptix and GreenSeeker (which senses crop vigour for use in determining on-the-go nitrogen rate recommendations).
“Let’s say you’re doing 2.5-acre grid soil sampling, then you have one sample point per 2.5 acres. Compare that to 335 points per acre [with our soil sensor]. I’m not saying that every data point is perfect, but we have a lot more points to be able to see the trends within the field. That gives us more data to use in making prescriptions that can be uploaded into an applicator that is readily available in today’s marketplace, or even sitting in a lot of growers’ sheds.”
These soil sensor systems involve placing a sensor near, on or in the soil. Each type of sensor has its own particular approach to sensing soil variation. In most systems, a user drives the sensor over a field in a series of parallel passes, as the sensor continuously maps the variation in whatever properties are being sensed. The sensor information also needs to be supplemented with lab analysis of targeted soil samples collected from the field. That soil sample information is used in calibrating the sensor readings for the field’s specific conditions, to allow modelling of in-field variations of different soil characteristics.
The three soil sensors being compared in Adamchuk’s project are Dualem-21S, the Veris MSP3 and SoilOptix. “They represent the most common sensing methods, covering over 90 per cent of publicly available proximal soil sensing services,” explains Adamchuk.
“The Dualem-21S is an electromagnetic induction instrument that measures apparent soil electrical conductivity. In Ontario in most cases, this reveals differences in soil texture. It has an effective measurement depth down to three metres. It is a Canadian-based instrument and is very similar to that used by Soil Information System [from Trimble], which is another sensor service available to farmers.” The Dualem-21S is pulled over the soil surface using a specially developed sled; the researchers are using a John Deere Gator to pull the sled.
The Veris MSP3 is a mobile sensor platform with three different sensors and is pulled by a tractor. One sensor measures apparent soil electrical conductivity using a galvanic contact approach, and is a type of instrument that has been used for a long time in soil sensing work. A second sensor measures subsoil optical reflectance (simply put, the soil’s colour), which is then related to soil organic matter content. The third sensor directly measures soil pH. When Adamchuk was at Purdue University, he and his research group developed this pH sensor and licensed it to Veris Technologies. He notes, “It is the only commercially available chemical sensor for on-the-go measurement at this time.”
SoilOptix, which is from the Netherlands, measures naturally occurring radiation from the soil, determining the levels of certain common isotopes of gamma ray radiation. Adamchuk says, “By its ability to differentiate those very low levels of radiation, we can characterize differences in soil texture and soil mineralogy close to the surface.” SoilOptix is carried above the soil surface on a Kubota ATV. Raymer notes that Practical Precision calibrates the SoilOptix data to provide 17 different maps showing predicted variations in the levels of such soil properties as texture, calcium, magnesium, phosphorus, potassium, pH and organic matter.
All three systems produce high-resolution elevation maps. “Each system uses RTK-GPS, so we always get field topography with elevation resolution of plus or minus three centimetres,” Adamchuk explains.
He is collaborating on the project with people from OMAFRA, Practical Precision and DuPont Pioneer. The project runs from 2015 to 2018 and is funded by OMAFRA’s New Directions program.
Along with comparing and validating the performance of the three sensors at different field sites, the project is exploring whether using several sensors to map a field might allow better differentiation of the field’s variability.
Adamchuk explains, “The different sensors are looking at the soil from different perspectives, measuring different physical quantities. Various factors, like soil texture, organic matter and moisture, affect every sensor but to a different degree. So our hypothesis is that when we use sensors with different measurement principles, we can remove some of those effects and really see what is happening with soil texture, soil water-holding capacity, soil nutrient-holding capacity, potential productivity, potential soil organic matter available for mineralization, and things like that, which affect productivity.”
Another component of the project seeks to optimize the soil sampling procedures by fine-tuning factors like how many samples are needed and where to take them. “We know that, by using sensor data, we can better place our samples and in many cases significantly reduce the number of samples needed,” he says.
Adamchuk’s research group at McGill has already developed several prototype software programs for optimizing soil sampling and sensor use. In this project, they are collecting data from a diversity of Ontario fields, including some with very unusual features, so they can test the software and ensure it is robust enough to handle data from a wide range of conditions.
In 2015, the researchers started collecting data from about two dozen sites in southern and eastern Ontario involved in a Grain Farmers of Ontario study, as possible sites for Adamchuk’s project. Out of those sites, they will choose the six that would be the most challenging for their software and that would provide the most information on the differences between the sensors.
In addition to the three commercial sensor systems, the project is also testing several prototype systems that Adamchuk and his group at McGill are developing. Also, at one or two sites, the project team hopes to try some additional sensors, like an on-the-go soil moisture sensor. “We have found that for Quebec and Ontario soil moisture is a quite useful layer of information because a lot of variability here is due to differences in water. Topography helps a lot with that, but not always,” Adamchuk explains.
The researchers will also be relating the soil sensor maps to yield maps and field imagery captured by satellites or drones. Also, OMAFRA’s soil science personnel are digging some soil pits to provide detailed soil profile information.
One challenge in mapping Canadian fields with these sensors is that the mapping season is short. “For instance, you need to do the mapping when the crop is not present and when the soil is not prone to compaction and things like that,” Adamchuk says. “However, there are some ways of using those sensors together with other operations.”
Fortunately, most of the data collected by the soil sensors remains about the same from year to year, unless major impacts occur, like land levelling, very heavy manure applications or severe erosion events. For the researchers, this means that any sensor data they weren’t able to collect in 2015 can be collected in 2016. For a farmer, it means a field’s soil sensor data will be good for many years.
Using soil sensor information
Information from soil sensors can be used in combination with other information sources, like yield maps, topographic maps, agronomic research results and the farmer’s own experience, to help in making decisions on variable rate management.
“If you have all those various pieces of information, it helps you make stronger and better decisions,” Raymer says. He explains that every information source has its strengths and weaknesses. “For example, not every grower has a yield monitor on their combine. And if they do have a monitor, then they may not have set it up correctly or maybe they haven’t taken the time to get it properly calibrated. And if they are just starting to use a yield monitor, it is a little risky to base management zones on one or two or even three years of yield data. Three is a nice start, but I’ve heard a rule of thumb that you should have at least seven to 10 years of good yield data to be able to filter out the effects of things like weather patterns.”
Rabe points out that combining information from elevation maps, soil sensors and crop sensors often reveals similar patterns, with better crop growth and yields in the lower parts of the field. “We need the topographic information because soil moves downhill over the years with tillage practices,” she says. So soil tends to be eroded from the upper slopes and deposited in the low spots. “In your soil mapping, you should see those low spots with a thicker A horizon, higher organic matter and likely more mineralizable nitrogen. The crop almost always performs well in those low areas, unless the growing season is very wet and there is some water standing. The top-of-knoll positions are usually more eroded, with a more disturbed A horizon, less organic matter and less mineralizable nitrogen [so the crop usually doesn’t perform as well].”
“What’s really interesting is when you see anomalies that don’t follow that story. Then you need to investigate those areas further to understand what is going on,” she adds.
Rabe is particularly intrigued by the potential benefits from combining soil sensor and crop sensor information. “When you marry those pieces of information, it tells a more powerful story over time.”
“It has always been in the back of my mind to do interfacing of soil sensor information with, let’s say, a GreenSeeker from a nitrogen perspective,” Raymer notes. “Let’s say we know some properties of the soil, like organic matter and the water-textural relationship, that influence nitrogen, and the field has a sandy area where we know the vegetation level is going to be low. The GreenSeeker might say there is an opportunity to put more nitrogen there. But nitrogen may have a tendency to leach out of those sandy soils, and it could be a poor performing part of the field. So it wouldn’t make economic or environmental sense to apply extra nitrogen there. We could create a prescription to override the GreenSeeker in that part of the field, and tell it to just apply 10 gallons, or whatever rate. So we could get the strengths of both systems by bringing them together.”
Adamchuk suggests a couple of possible approaches to using soil sensor maps. For instance, you could use regional research information on managing low productivity areas and high productivity areas, and then use the map to target the appropriate practices. He gives an example: “In Ontario, we know that a low elevation, high electrical conductivity soil might benefit from a higher seeding density. And on a low electrical conductivity or high elevation area, if the area has historically had lower yields, then a lower seeding rate will not affect the yield data but the farmer will save the cost of a few extra bags of seed.”
Another possibility would be to set up a small trial to see if variable management of an input on a particular management zone would make a difference. “You could manage the entire field the way you usually do, but then in those specific areas, you could apply a little less or a little more. If you have variable rate control equipment, then setting up research plots is relatively simple. It’s just a few minutes to draw a polygon on the screen, and then you would say for this area I want to lower the seeding rate, for example,” he explains. “Then, with your yield map at the end of the season, you could see whether or not you have a yield reduction on that area. And the rule of thumb is that, if you don’t see any difference, then for the next season you do what is cheaper. If you do see a difference, then you can calculate the costs and benefits and see what makes the most sense.”
Adamchuk adds, “With pH maps, using the information is very straightforward: you just don’t lime areas with neutral and alkaline soils.” That’s a real advantage compared to applying lime at uniform rate across a field, with some of the lime going on areas where it is not needed and either provides no benefit or is harmful. “If lime is applied on soil that is already slightly alkaline, you may end up with phosphorus and micronutrient deficiencies, which may create some additional problems in the long run.”
Rabe concludes, “It’s an exciting time for soils, and Ontario is pretty lucky to have a number of soil sensor options to look at and review, and to have the expertise of people like Viacheslav Adamchuk.”