Features
Fertilizer
Seed & Chemical
Addressing the soil K decline
November 30, 1999 By Heather Hager
 Under a standard rotation of corn and soybeans (and wheat) in southwestern Ontario Despite the fact that Canada is one of the world’s foremost potash producers
Despite the fact that Canada is one of the world’s foremost potash producers, soil test potassium levels in Eastern Canada have declined in recent years. The International Plant Nutrition Institute (IPNI) surveyed soil test K levels from public and private laboratories across the provinces and US states in 2001, 2005 and 2010. It found that the proportion of samples showing soil test K levels less than 121 ppm in tests used for 2010 decision making increased over that in 2005 and 2001 in Eastern Canada. And soils testing at those levels are expected to show medium to high probabilities of an economic yield response to fertilizer application, according to Ontario Ministry of Agriculture, Food and Rural Affairs (OMAFRA) guidelines. “In Ontario, the proportion of soils testing 80 ppm or less in K grew from 15 percent in 2005 to 20 percent in 2010,” says a brief summary of the IPNI report. “Soils testing in this range are likely to produce K deficiencies in almost any crop in the absence of fertilization.”
The summary is available on the IPNI website (nane.ipni.net/articles/NANE0047-EN).
Given the high potash prices in 2008 and 2009, many people agree that it is not surprising to see a decline in soil test K. “In Eastern Canada, the decline is fairly consistent, particularly in Ontario and Quebec,” says Dr. Tom Bruulsema, director of IPNI for northeastern North America. “When potash prices went up, there was a significant reduction in potash fertilizer sales at that time; we knew less was going on, and we had some fairly decent crops. So we expect soil test levels to be down somewhat.”
Speaking of the past 10-year trend in fertilizing, Colin Smith, product manager at United Agri-Products Canada, says, “When I started in the business, it wasn’t unusual to have a grower putting 600 to 800 pounds per acre of dry product down before he planted, as a broadcast, a mix of N, P and K. This last four or five years, what’s been going down is probably 200 to 300 pounds per acre, and most of that being N.”
Dale Cowan, senior agronomist for Agris Co-op, thinks the slide in soil test K has been an even longer-term phenomenon. He suggests that K levels have been declining for 15 to 20 years, and it is just now showing up in the overall trend line. “When I look at southwestern Ontario, where I’m operating right now, and I look at what’s been applied versus what’s been removed, and when you annualize, let’s say, a corn-soybean-wheat rotation, for every pound of potassium that’s been removed in crop removal, we’re only putting back about 0.6 pounds.
So we’re in a negative or a mining situation, on some of the farms anyway. We’re just not keeping pace with crop removal.”
Long-term IPNI figures for Eastern Canada would seem to support this idea. “In most of the past 40 years, the amount of K applied as fertilizer and recoverable manure has not been sufficient to match crop removal,” says a report on crop potassium balance from 1969 to 2009 for Eastern Canada. This indicates a chronic mining of soil K that could be starting to show up as yield loss.
To see the report for Eastern Canada, visit nane.ipni.net/articles/NANE0020-EN (for Ontario, nane.ipni.net/articles/NANE0033-EN; Quebec, nane.ipni.net/articles/NANE0037-EN; Atlantic Canada, nane.ipni.net/articles/NANE0040-EN).
Other considerations
Another potential factor in the K decline that is raised by both Smith and Pat Feryn, an independent certified crop advisor in the Stratford, Ontario, area, is the use of liquid starter or “pop-up” fertilizers. These agronomists suggest that there may be growers who think a starter fertilizer applied with the seed will be sufficient nutrition. This is not the case, however, as starters have lower N and P than the total crop requirement and often have no to low K. A 2010 Virginia Extension publication notes, “Potassium removal rates are such that not enough K can be supplied in starter or pop-up fertilizers to supply plant needs, and yield reductions will be seen if no other fertilizer is applied.”
For growers who are using starter fertilizers, Feryn notes that ongoing work by OMAFRA corn specialist Greg Stewart is showing that when soil test K is low, i.e., in the 60 to 80 ppm range, starter fertilizers containing N, P and K often produce an economical yield response over starters containing only N and P. And at one of the low-testing field sites, in Elora, Ontario, a starter with K boosted yield even when K was broadcast in the preceding fall.
Tracking soil K
With the current high commodity and lower fertilizer prices, Smith thinks that many growers are taking the opportunity to build fertility levels back up. A two-pronged approach is the best way to determine which direction K levels are going. A grower should look at both soil test K and estimates of crop removal, determined by multiplying yields by book values for K removal, for optimal management. “Essentially for each field, a grower should have a nutrient balance – what’s going into the field and what’s coming out,” says Bruulsema. “You want to be ensuring you have some checks and balances to ensure that you know what direction your soils are going.”
 |
|
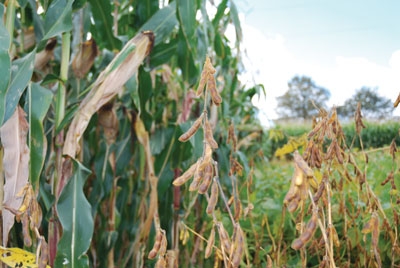
| Ongoing work by OMAFRA’s Greg Stewart showed that in one low-testing field site, a starter fertilizer with potassium boosted yield, even though potassium was broadcast in the preceding fall.
|
This way, a grower can track the effects of management over time. If the grower thinks adequate potash was added but soil test K continues to decline, then the replacement rate needs to be increased. Conversely, if soil test K is increasing, the replacement rate is allowing for some rebuilding of the soil K pool.
Bruulsema recommends taking a soil test at least every three years, at the same time of year, and following the same crop in the rotation for the most consistency. Changes in soil test K could be dramatic or slight, depending on a grower’s management regime. “For example, if you’re growing alfalfa and you’re not applying any potassium, and you’re removing several hundred pounds per acre per year, you’re going to expect to see fairly quick changes in the soil test. On the other hand, if you’re close to balancing removals with what you apply, you might expect to see little change in the soil test from one time to the next,” he says.
The number of producers that are soil testing regularly continues to improve. The latest data, collected by Statistics Canada in 2006, show that seven percent of Ontario cropland is tested annually and about 60 percent is tested every two to three years. Across Canada, some 22 percent of farms could see improvement, with 10 percent having soil tested every six years or more, and 12 percent not testing.
How much is enough?
For growers who are putting K back into the soil, the main question is: How much is enough? Increasingly, agronomists are questioning whether the OMAFRA guidelines are still adequate or if they need to be revisited given today’s commodity prices, crop rotations, and higher yielding hybrids. “I think their research is based back in the ‘50s, ‘60s, and early ‘70s, and it hasn’t looked at the trends or changes that have occurred in the industry in the higher yields,” says Smith. “I think their ranges are too conservative.”
He cites an alfalfa operation he worked with that followed the guidelines to replace crop K removal but still saw soil test levels drop. “They needed to be putting more back on than what the guidelines were indicating,” he notes. Both alfalfa and silage corn are large draws on soil K because the leaves and stems are not returned to the soil.
However, a 1997 OMAFRA fact sheet says, “Since their initial establishment, the fertilizer requirement tables have been adjusted on numerous occasions based on information from response trials using current hybrids and management practices.” Since then, additional studies have examined the effects of higher K applications, says Bruulsema. One of these, a five-year study ending in 2006 by Drs. Bill Deen and John Lauzon (University of Guelph) and Bruulsema, did find increases in corn yields with a high potash application (180 lbs of K2O per acre), but it was not more economically advantageous than the slightly lower yield at the lower level of potash application (30 lbs of K2O per acre, see www.ipni.net/ppiweb/bcrops.nsf/$webindex/82412D4419AA10C0852572DE005BAF12/$file/07-2p20.pdf ).
In addition, Stewart and Ken Janovicek, a research associate at the University of Guelph, have been collecting phosphorus (and some potassium) fertility data from the past 40 years to re-evaluate the OMAFRA recommendations. That analysis is complete, says Stewart, and communication details are being finalized.
Oilseeds also remove quite a bit of K, and rotations in Eastern Canada are seeing a lot more soybean than in previous decades. “It may still surprise some people that a 40-bushel crop of soybeans removes quite a bit more potassium than a 150-bushel crop of corn,” says Bruulsema. “The concentration of potassium in the seeds of soybeans is quite high, about 1.5 percent or so, and so you’re looking at fairly large removals there.” Comparatively, the amount of K removed in grain corn is “really not that big,” he says.
“The irony is that a 50-bushel soybean crop removes almost twice the potash that a 180-bushel corn crop removes, and yet we tend not to fertilize soybeans,” says Cowan. “We tend to work off the residual fertilizer from the corn.” If corn is not being fertilized at removal rates, that would leave even less available for the subsequent soybean crop, he notes.
However, Cowan also thinks that the newer corn hybrid genetics could be masking the effect of lower soil K. For example, by allowing for a larger, healthier root mass, the corn rootworm protection trait lets the plant mine a greater volume of soil. “When you look at an element like potassium, it’s not very mobile in the soil, so it requires an ever expanding root system to go out and get it. If the plant is occupying a much greater volume of soil with a massive healthy root system, it’s going to find more potassium, even at a low soil test level,” he suggests.
Rebuilding soil K
Rebuilding soil test K from a low level could be fairly expensive and take a number of years. “If you’ve gone from 120 ppm down to 80 ppm on a sandy soil, that could take 400 pounds of potash just to get your soil test level back,” estimates Cowan. “And in the meantime, you have to account for all the crop removal. So if you decide to do that over five years, that’s 80 pounds extra overtop crop removal that you’ve got to put on every year to get your soil test levels back up.”
Whether a grower needs to add or draw down K in a given year will depend on four things: soil test and crop removal K levels, commodity prices, and fertilizer prices. “If you’ve got really low soil test levels, commodity prices go against you, and the fertilizer price goes up, you’re kind of caught because if you cut back on fertilizer, you’re going to lose yield potential,” says Cowan. “A lot of farmers will manage with their soil test levels in the high category, and what that does is, at the end of the season, you don’t have to ask yourself the question: What would my yields have been if I’d just used a little bit more fertilizer?”
As crop yields have increased, K has become ever more critical than before, notes Bruulsema. However, commercial fertilizer prices have also increased. Growers who have access to low-cost manure will have an advantage in maintaining K fertility, as will those whose nutrient checks and balances allow careful, judicious use of fertilizers.