News
The Prairie provinces are heating up
Hard to believe, coming off of two cold springs and summers, that the Prairies are getting hotter. But an analysis of Prairie Crop Heat Units (CHU) shows just that: it is getting hotter, and that may be a good thing.
February 24, 2010 By Donna Fleury
More CHUs available for crop production.
Hard to believe, coming off of two cold springs and summers, that the Prairies are getting hotter. But an analysis of Prairie Crop Heat Units (CHU) shows just that: it is getting hotter, and that may be a good thing.

|
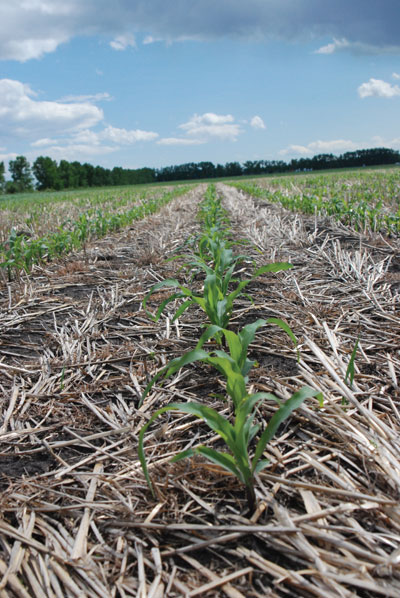
| There was a 300-unit increase in CHU during the 100-year period on the Prairies.(Photo by Bruce Barker) Advertisement
|
Andy Bootsma, agroclimatology consultant and honorary research associate with Agriculture and Agri-Food Canada (AAFC) in Ottawa, conducted research to determine if CHUs have increased across the Prairie provinces and what the increase might mean to producers. Crop heat units are temperature-based units that are related to the rate of development of corn and soybeans, and are a better measurement for achieving physiological maturity than calendar days. Areas with higher CHU values can grow longerseason varieties, which typically provide higher yielding crops. “We looked at 10-year or decadal trends in CHUs for selected climate stations in the Prairie provinces, going back to the late 1800s to the present,” explains Bootsma.
The research uses the adjusted or homogenized climate dataset from Environment Canada, rather than raw climate data (www.cccma.bc.ec.gc.ca/hccd). This dataset is adjusted to account for changes in the climate data due to non-climatic factors such as exposure, location, observation practices, instrumentation or a combination of these. The adjusted database then reflects the real change in climate during the time period. “The research results show there is definitely some warming going on across the Prairie provinces,” says Bootsma. “We concluded that on average of all locations reviewed, there was slightly more than a 300-unit increase in CHUs during the 100-year period. Although that is only about 30 units per decade, cumulatively the 300 units is significant.”

|
|
| Figure 1. Decadal Trends in Crop Heat Units at eight locations in Alberta and Saskatchewan (based on homogenized data from Environment Canada). Graphics courtesy of Andy Bootsma. |
|

|
|
| Figure 2. Decadal Trends in Crop Heat Units at seven locations in Saskatchewan and Manitoba (based on homogenized data from Environment Canada) |
Bootsma is not sure what the increased CHUs can be attributed to, but speculates that increases may be due to global warming, or some of the warming in the early 20th century could be due to summerfallow or other factors. “For Prairie producers, an increase in 300 units means they can probably select and plant longer season corn hybrids and soybean varieties,” explains Bootsma. “Longer season varieties should also result in increased yields, as long as the moisture supply is adequate. It is also likely that the traditional areas where corn and soybeans can be grown on the Prairies may be gradually expanded because of this increase in CHUs.”
Bootsma has done similar research in Eastern Canada, and has data that shows that as the average number of CHUs available increases by 100 units, the corn yields are higher on average by about 0.6 tonnes/ha (about 9.5 bu/ac). “We’re not sure if the same response is true for the Prairie region, as it would depend on adequate moisture and the Prairies tend to be drier than Eastern Canada,” adds Bootsma. “However, if moisture was adequate, this would mean about a 200 kg/ha (about 3.0 bu/ac) increase in corn yield per decade, assuming an average trend of 30 CHU increase per decade.” For soybeans, average yields in Eastern Canada typically increase about 0.13 tonnes/ha (2.1 bu/ac) for each 100 CHU. If the same were true for the Prairies, that would mean about 40 kg/ha (0.6 bu/ac) increase in yield
per decade.
This yield increase due to increased CHUs only includes the effect of being able to grow longer season hybrids and varieties at locations with greater CHU ratings. It does not include any increases due to better breeding, improved varieties, changes in technology over time or other factors.
Trends in water deficits and aridity indices on the Prairies
Using a similar research process, Bootsma also looked at the trends in water deficits and aridity indices in the Prairie provinces since 1897. He wanted to find out whether the Prairies were getting wetter or drier during that same period. Water deficits relate to the amount of water, or lack thereof, available for crop growth. Deficits are often determined by balancing rainfall with evapo-transpiration. “We computed two different types of deficit using average monthly maximum and minimum temperatures and precipitation for 10-year or decadal periods going back to 1897, to determine if these are changing significantly over time,” explains Bootsma. “The deficits included a water deficit for the growing period of spring wheat (DEFwheat) and an aridity index.”
After reviewing the selected station data during the last 100 years, the results show no apparent trend of either increasing or decreasing wheat deficits or aridity indices over time. “We couldn’t show a significant trend that the Prairies were either getting drier or wetter,” says Bootsma. “There is a lot of cycling occurring, with some drought decades and wetter decades, but overall the trend in the data we used doesn’t show that the Prairies are getting wetter or drier.” Similar research is ongoing for Ontario, Quebec and the Maritimes. n