News
World Outlook
Business & Policy
Canada’s realized net farm income down in 2018
June 12, 2019 By Statistics Canada
 Rising feed, interest and labour costs together with little change in farm cash receipts pushed realized net farm income lower. Source: Statistics Canada.
 Canadian agricultural producers experienced the largest percentage decrease to realized net farm income since 2006, according to Statistics Canada’s farm income report for 2018.
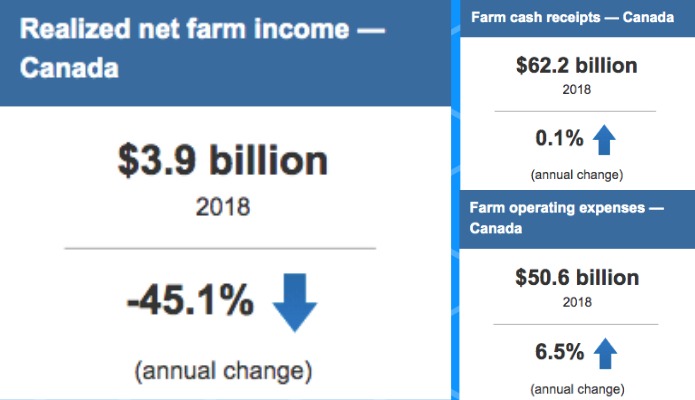
The realized net farm income of agricultural producers fell 45.1 per cent in 2018 to $3.9 billion, the largest percentage decrease since 2006. This followed a 2.8 per cent decline in 2017.
Realized net income is the difference between a farmer’s cash receipts and operating expenses, minus depreciation, plus income in kind. Rising feed, interest and labour costs together with little change in farm cash receipts pushed realized net farm income lower.
Realized net income fell in every province except New Brunswick (+7.2 per cent) where an increase in cannabis and potato production boosted receipts. More than one-third of the national decrease was attributable to a 68.1 per cent decline in Alberta.
Little change in farm cash receipts
Farm cash receipts, which include crop and livestock revenues as well as program payments, edged up 0.1 per cent to $62.2 billion in 2018. This followed a 2.6 per cent rise in 2017.
Farm cash receipts declined in five provinces, with the largest drop in Alberta (-4.0 per cent), while New Brunswick, Quebec, Ontario and British Columbia posted gains.
Market receipts totalled $60.0 billion in 2018, up 0.4 per cent, as a small rise in crop receipts more than offset a small drop in livestock receipts.
Market receipts are the product of price and marketings. Marketings are quantities sold, using various units of measure.
Increases in wheat and cannabis receipts lead to slight rise in crop receipts
Crop revenue edged up 0.9 per cent to $35.0 billion in 2018 as increases in wheat (excluding durum) and cannabis revenues more than offset a decline in canola receipts.
Wheat (excluding durum) receipts were up 11.6 per cent—the second consecutive annual double-digit increase. Both prices and quantities sold rose, as exports to China almost tripled.
The revenue of licensed cannabis producers totalled $564.1 million in 2018, up from $189.0 million in 2017. The recreational use of cannabis became legal in October 2018, contributing to the 198.4 per cent hike in receipts.
Receipts for corn producers increased 9.9 per cent on rising prices and marketings.
The 6.5 per cent decline in canola receipts was driven by decreased marketings as exports were down. Canola producers in Alberta were especially hard hit as canola receipts decreased 16.1 per cent. Marketings fell by a similar percentage, in the wake of rail disruptions early in the year, a late harvest and lower production.
Falling prices pushed lentil revenues down 35.1 per cent. The imposition of duties by the Indian government in late 2017 on imports of lentils curtailed exports, sharply lowering prices. These duties also applied to dry peas with similar results. Dry pea revenue fell 19.7 per cent as prices declined 17.2 per cent.
Falling hog receipts push livestock receipts down slightly
Revenue from livestock production edged down 0.2 per cent to $25.0 billion in 2018.
Hog receipts were down 8.9 per cent on lower prices as North American inventories reached record highs in 2018. Retaliatory pork tariffs imposed on the United States by China and Mexico also contributed to the surplus of hogs in the United States, reducing demand for Canadian exports.
Moderating the decline in livestock revenue was a 2.8 per cent rise in the receipts of supply-managed commodities. Chicken receipts were up 5.9 per cent, with both prices and quantities sold increasing.
There was little change in the cattle and calf sector, with receipts edging up 0.1 per cent as small price decreases were more than offset by higher marketings.
Program payments to producers fell 8.9 per cent to $2.2 billion in 2018. Crop insurance payments were down 27.2 per cent, following a 17.3 per cent rise in 2017.
Biggest increase in farm expenses in six years
Farm operating expenses (after rebates) increased 6.5 per cent in 2018 to $50.6 billion—the largest percentage increase since 2012.
Feed costs were up 9.6 per cent, largely due to rising prices as feed grain supplies were tight prior to harvest. A large influx of imported corn from the United States provided an alternative source of feed.
Interest expenses (+19.5 per cent) increased sharply on rising average interest rates (+10.0 per cent) and debt levels (+8.7 per cent). This was the largest increase in interest expenses since 1981 (+49.5 per cent). While in 1981 interest expenses comprised a large share of total operating expenses (18.3 per cent), this was not the case in 2018 when the interest share increased to 7.2 per cent, up from 6.4 per cent in 2017.
Cash wages increased 8.0 per cent in 2018—well above the average increase of the previous five years (+3.5 per cent). Increased cannabis production and the impact on the horticultural sector of minimum wage legislation in Ontario strengthened the wage hike.
Higher prices pushed machinery fuel expenses up 18.1 per cent in 2018. This followed a price-related 9.3 per cent hike in 2017.
Total farm expenses—the sum of operating expenses and depreciation costs—rose 5.9 per cent to $58.4 billion in 2018 as depreciation charges increased 2.2 per cent.
Total farm expenses were up in every province, ranging from increases of 3.9 per cent in Newfoundland and Labrador to 14.0 per cent in New Brunswick.
Sharp decline in total net income
Total net farm income fell $5.2 billion to $3.0 billion in 2018.
Total net farm income is realized net income adjusted for changes in the farmer-owned inventories of crops and livestock. It represents the return to owner’s equity, unpaid farm labour, management and risk.
Lower on-farm stocks of barley, corn, wheat (excluding durum) and soybeans as well as decreased cattle and calf inventories contributed to the drop in the value of inventory change (-$865 million).
All provinces recorded declines in total net farm income.