Features
Environment
Wheat yield gaps in the Canadian Prairies
Examining the magnitude, implications and opportunities.
June 15, 2022 By Presented by Brian Beres, (Agriculture and Agri-Food Canad, Lethbridge, Alta.), Patricio Grassini, (University of Nebraska, Lincoln), Romulo Lollato (Kansas State University) and Aiden Sanden (University of Saskatchewan) at the Top Crop Summit, Feb. 23, 2022.
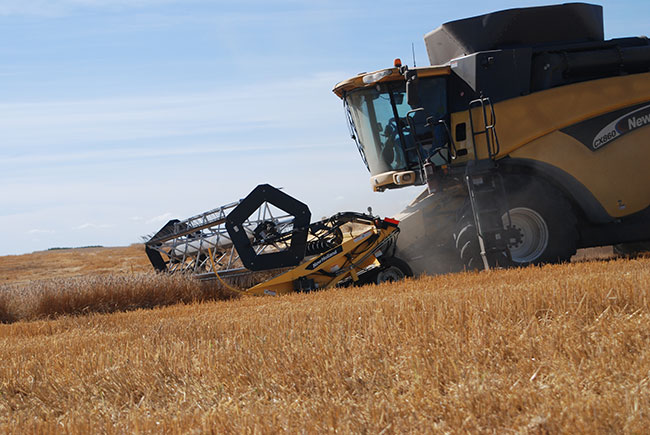 Photo by Bruce Barker.
 To introduce the concept of wheat yield gaps in Canada, Brian Beres explains that as wheat production on the Prairies evolved, it moved from when soils were first plowed to no-till systems that conserve soil health that allowed for increased crop diversity. Today, the complexity of the production system increases in the move to maximum yield. Maximum yield can be expressed by the equation of Genotype x Environment x Management.
A good example of these interactions comes from research in Australia. A low-input system provided a wheat yield of 1.6 tonnes per hectare. But when they added in a better rotation, summer weed control, no-till, early seeding and a new variety, the synergy of the system increased yield to 4.5 t/ha.
The challenge is to constantly weave in new technologies that will flourish in the field under unpredictable conditions of Prairie farmlands.
This challenge was the impetus for an international research partnership for wheat improvement, proposed by Hélène Lucas of France’s INRA in 2011 called the Wheat Initiative. The Wheat Initiative Strategic Research Agenda now has linkage in Canada at a national level with Cereals Canada teaming up with AAFC developing national research priorities, which are also now aligning with Grower Commission priorities at the provincial level.
Patricio Grassini outlined the reasons for the Global Yield Gap Atlas project. He says that the increase in food demand (+50 per cent) over the next 30 years due to population increase and higher calorie intake, especially in developing countries, will challenge food production. Current crop yields are not sufficient to meet the extra food demand on existing cropland area. Massive cropland area expansion during the last 20 years (+13 million hectares per year) at the expense of forests, wetlands and other fragile ecosystems is a concern. On top of that, there is growing demand from society to know about the environmental impacts of food production systems.
Meeting the growing food demand must be achieved through sustainable systems so that every single hectare of existing cropland produces near its potential while minimizing environmental impact and preserving the resource base.
In the real world, attaining 80 per cent of yield potential is a reasonable target for farmers with access to inputs, markets and extension services. In the real world, there are hardly any cropping systems that can reach 80 per cent of yield potential. The difference between the 80 per cent potential and the average farm yield is called the “exploitable yield gap.”
About 12 years ago, the Global Yield Gap Atlas project was initiated by the University of Nebraska and the University of Wageningen (Netherlands). It uses a bottom-up approach to estimate yield gaps, where the yield gaps are estimated regionally, nationally and globally. So far, it covers 70 countries and 90 per cent of rice, 84 per cent of maize, 56 per cent of wheat and 82 per cent of soybean crops grown in the world. The atlas can be accessed at www.yieldgap.org
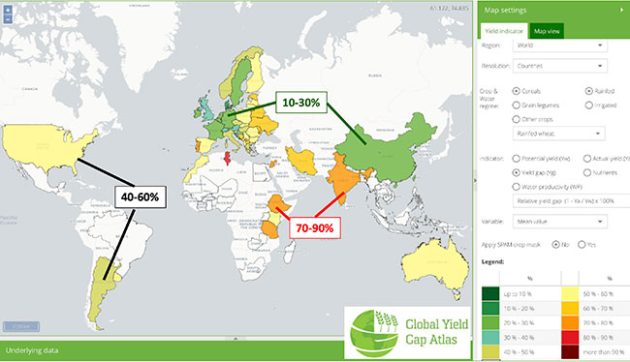
EXAMPLE OF YIELD GAPS FOR WHEAT (RED INDICATES THE LARGEST YIELD GAPS AND GREEN INDICATES THE SMALLEST GAPS). Image Courtesy of the Global Yield Gap Atlas.
The protocols used to estimate yield gaps are used globally. They take into consideration climate zones, crop-specific harvested areas, weather station data, soil types and cropping systems. This information is fed into crop model simulations to estimate yields, which are compared to average farm yields to estimate the yield gaps.
In places where social-economic conditions aren’t favourable for wheat production, like rainfed sub-Saharan, Africa and India, the yield gap is 70 to 80 per cent.
Beres says that developing a Yield Gap Atlas for wheat in Canada used those same protocols. An important component in getting started was the distribution of weather stations in wheat-producing areas. Government of Canada weather stations with at least 30 years of daily data, or a suitable alternative, were utilized. There is an art to the science of selecting the right weather station for the right wheat-producing areas to produce “buffer zones.” Twenty-seven
buffers were selected that represented about 50 per cent of the national wheat area. The data confirmed that these buffers were unique production areas.
Buffer zones developed for the Canadian Wheat Yield Gap
Red areas (“buffer zones”) represent study areas, from which management information and weather data will be collected. Blue borders indicate that the buffer has irrigated production.
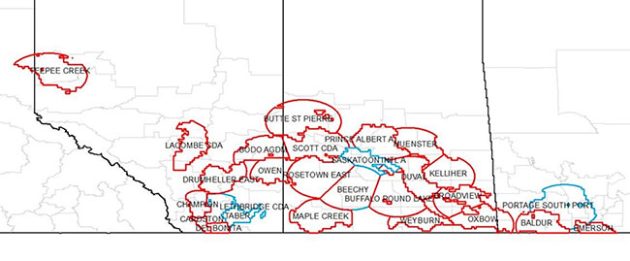 The model developed suggested that the average yield potential ranged from 52 to 89 bushels per acre in the different buffer areas. The yield gap varied quite a bit, and ranged from an average of 15 to 40 per cent on the Prairies. The average yield gap is 33 per cent on rainfed and about 32 for irrigated. These results shows Canada is doing well, but also shows that there is room for improvement. It gives the information to guide research, which may not be the same across the buffer zones.
In the U.S., Romulo Lollato says yields in the northern spring wheat areas are about 60 to 70 per cent of potential yield, and the yield gap is larger into the central and southern winter wheat regions.
The second stage of the U.S. Wheat Yield Gap Atlas project was trying to understand those yield gaps. A project in Kansas surveyed winter wheat growers on their management practices. Information was gathered from 700 fields across three years.
The average wheat yield was about 57 bu/ac but it ranged from five bu/ac to 106 bu/ac. The information provided the data to analyze how yields were influenced by management practices.
For example, in western Kansas, winter wheat yield peaked when planted on Sept. 28, and then lost 3.5 bushels per acre per day (bu/ac/day) for later planting. In south-central Kansas, a warmer region, the peak yield was sown Oct. 14. The yield loss wasn’t as steep, losing 1.1 bu/ac/day up to the end of October, and then 2.7 bu/ac/day with later planting.
Foliar fungicide was also investigated. In wet seasons, a single application of a foliar fungicide yielded almost 10 bu/ac more, and in dry seasons, there was still a trend to 4.5 bu/ac higher yield.
At the University of Saskatchewan, Aiden Sanden is conducting research on understanding the yield gap with a focus on nitrogen fertilizer. The research question assumed that the goal is to maximize profits and not yield.
A model of wheat production was developed and determined the economically optimal rate for nitrogen. The research compared the average N use levels to the estimated optimal N level to establish if an exploitable yield gap exists.
Data from the Saskatchewan Crop Insurance Corporation provided one-quarter section-level yield, management and soil data from 2010 to 2019.
Three different models were run to estimate optimal versus actual N rates applied. The optimal rate was where the ratio of input price to output price was equivalent. Since the research was done, the price of wheat and N fertilizer has risen dramatically.
Model 1 found that the optimal N rate was estimated at 70 lbs/ac (79 kg/ha) while the average observed rate was 55 lbs/ac (62 kg/ha). Model 2 looked at previous crop interaction with N rate, and found that with cereals, the optimal N and observed N applied were very close. If oilseeds were previously grown, the average observed N rate was 18 lbs/ac (19 kg N/ha) less. For pulses, the difference was even greater with a difference of 43 lbs/ac (48 kg N/ha) less for the average N rate applied.
Estimated Optimal versus Actual N rates Saskatchewan Risk Zone 16
Model 3 took previous crop and soil groups into account. For the majority of soil groupings and previous crops, producers were underapplying N compared to the optimal rate. There is a significant gap following pulse crops. In the poorer soils in Groups 3 and 4, producers may be overapplying N.
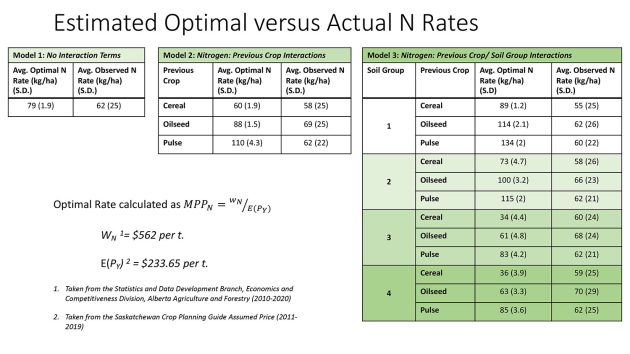
Courtesy of Aiden Sanden and Richard Gray, University of Saskatchewan.
Sanden’s research suggests that there is an Exploitable Yield Gap with N fertility in wheat.
Beres says that Sanden’s research is a good example of how research can investigate the Exploitable Yield Gap. Moving forward, Farming Smarter in Lethbridge, Alta., is leading the On-Farm Prairie CWRS Management Survey to help look at factors that may be contributing to wheat yield gaps on the Prairies.
Watch the presentation here:
www.youtube.com/watch?v=KFO8e2I-mfs