Features
Agronomy
Cereals
Wheat midge forecasting maps predict emergence
While the 2009 wheat midge infestation was considered a light year by historical standards, that did not make the scouting season any easier for those in risk zones. What did make a difference is a new version of the wheat midge emergence map, posted on the Canadian Wheat Board (CWB)’s website.
March 17, 2010 By Bruce Barker
While the 2009 wheat midge infestation was considered a light year by historical standards, that did not make the scouting season any easier for those in risk zones. What did make a difference is a new version of the wheat midge emergence map, posted on the Canadian Wheat Board (CWB)’s website.

|
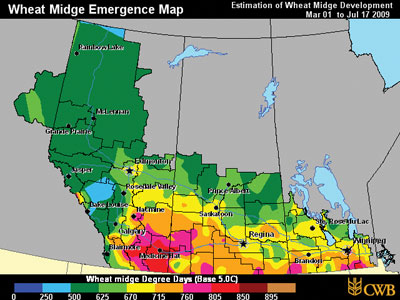
| This Canadian Wheat Board wheat midge map for July 17, 2009, shows accumulated degree days above five degrees C. (Photo courtesy of the Canadian Wheat Board)
|
First debuting in 2008, with refinements in 2009, the predictions are based on research by Dr. Bob Elliott, a research scientist at Agriculture and Agri-Food Canada at Saskatoon, Saskatchewan. “Historically, if you looked at the information on when wheat midge could emerge, a wheat producer could be out scouting for four to six weeks. Research helped to pinpoint emergence a little more closely using calendar days, but there was still a five- to seven-day window when the midge might be emerging. Using growing degree days has helped us narrow that down to two to three days,” explains Elliott. “It is definitely a time- and labour-saving device.”
Wheat midge scouting and control is based on when the crop is heading (wheat head becomes visible as the boot splits until the initial stages of flowering) and the adult midge density is at economic densities of one adult midge for every eight to 10 wheat heads during the susceptible stage if aiming for high quality grades. Economic thresholds for potential yield loss are one adult midge for every four or five wheat heads. By flowering, the wheat develops resistance to the midge larvae. By pinpointing when wheat midge is likely to emerge, farmers are able to narrow down their scouting activities.
Elliott originally evaluated adult wheat midge emergence at 19 sites in Saskatchewan from 1991 through 2000. Emergence was assessed in relation to calendar days and accumulated degree days (DD) above five base temperatures. This research formed the basis of the emergence map, and was re-assessed in 2008.
Dates for 10, 50 and 90 percent emergence of both sexes at 16 sites averaged July 11, July 18 and July 25, respectively. These dates predicted the timing of emergence in 2008 within one day or less. Elloitt explains that the results suggest that wheat midge populations in Saskatchewan reach potentially damaging numbers from July 11 until July 25 and tend to peak on July 18. However, he says, observed calendar dates varied by plus or minus 5.4 to 5.9 days at the 16 sites.
The variation in emergence dates from site to site resulted from the differences in accumulated DD between March 1 and July 31 says Elliott. Emergence was two to eight days earlier than expected at sites with the highest DD accumulation and four to 10 days later than expected at sites with the lowest accumulation. “Clearly, emergence occurred earlier than expected when temperatures were above average and later than expected when temperatures were below average,” he explains.
Degree day accumulation most accurate for prediction
Accumulated DD above five degrees C in the spring provided the most accurate estimates. With a five degree C base air temperature, accumulated DD for 10, 50 and 90 percent emergence of both sexes averaged 693 DD plus or minus 2.8 days, 784 DD plus or minus 2.5 days and 874 DD plus or minus 3.2 days, respectively. These estimates minimized differences between observed and expected emergence times at most sites and predicted 10, 50 and 90 percent emergence in 2008 within 35 DD or less.
Elliott explains the findings suggest that DD accumulations, calculated from air temperatures above five degrees C, provide accurate estimates of when potentially damaging adult numbers start to occur (693 ± 39 DD; 10 percent emergence), when adult populations tend to peak (784 ± 38 DD; 50 percent emergence) and when adult numbers become less damaging (874 ± 41 DD; 90 percent emergence).
In 2008, the CWB developed its wheat midge emergence map, based on Elliot’s research, and posted it on the website. The map used average minimum/maximum temperatures after April 1. Temperature information was gathered from WeatherBug stations located on farms and at grain handling and ag retailer sites, as well as Environment Canada weather stations. “Using Dr. Elliott’s model, and the weather data from our network, we were able to develop the wheat midge emergence map, and provide daily updates starting in late June,” explains Mike Grenier, CWB agronomist at Winnipeg, Manitoba.

|
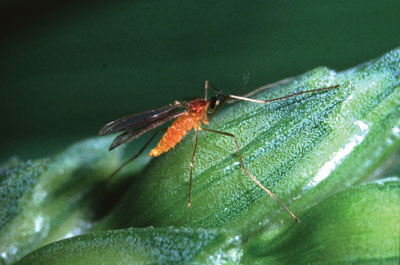
| Wheat midge are approximately 10 percent emerged when accumulated degree days reach 693 plus/minus 39. (Photo courtesy of Agriculture and Agri-Food Canada)
|
In 2009, the predictions were modified to use a sine wave calculation that allowed the counting of DD above five degrees C starting March 1. This approach provides a more accurate prediction of wheat midge emergence.
Grenier says that in 2008 when wheat midge numbers were predicted to be high, the map website received approximately 14,000 hits. In 2009, with lower risk projected, about 6000 hits were registered on the website. “From the feedback we received, the map was well received as a tool to help monitor wheat midge,” says Grenier. “We hope to launch more weather-related decision tools in the future.”
In his trials, Elliott also observed differences when rainfall was abnormally low or high. Emergence was one to seven days earlier than expected at sites that received 20 to 30 millimetres (0.8 to 1.2 inches) rain in May and one to eight days later than expected at sites that received more than 145 millimetres (5.8 inches) rain in May and June. Results suggest that dry soils warm more rapidly than moist soils. Low rainfall accelerates DD accumulation in the soil and advances midge emergence whereas high rainfall reduces DD accumulation in the soil and delays midge emergence. “Ideally, if we could have soil temperature data rather than air temperature, we could get away from the differences in emergence due to soil moisture. The degree day accumulation in the soil would make the prediction even more accurate,” says Elliott.
Currently, he is working on soil DD models for oilseed insects, but may be able to apply that information to wheat midge some time down the road.