Precision Ag
Managing yield data
Harvest is the time of year when farmers reap the rewards from a season of hard work, worry and risk. They treasure the perfect harvests when the weather co-operated and yields surpassed expectations. The worst years serve as useful reminders of the challenges of farming.
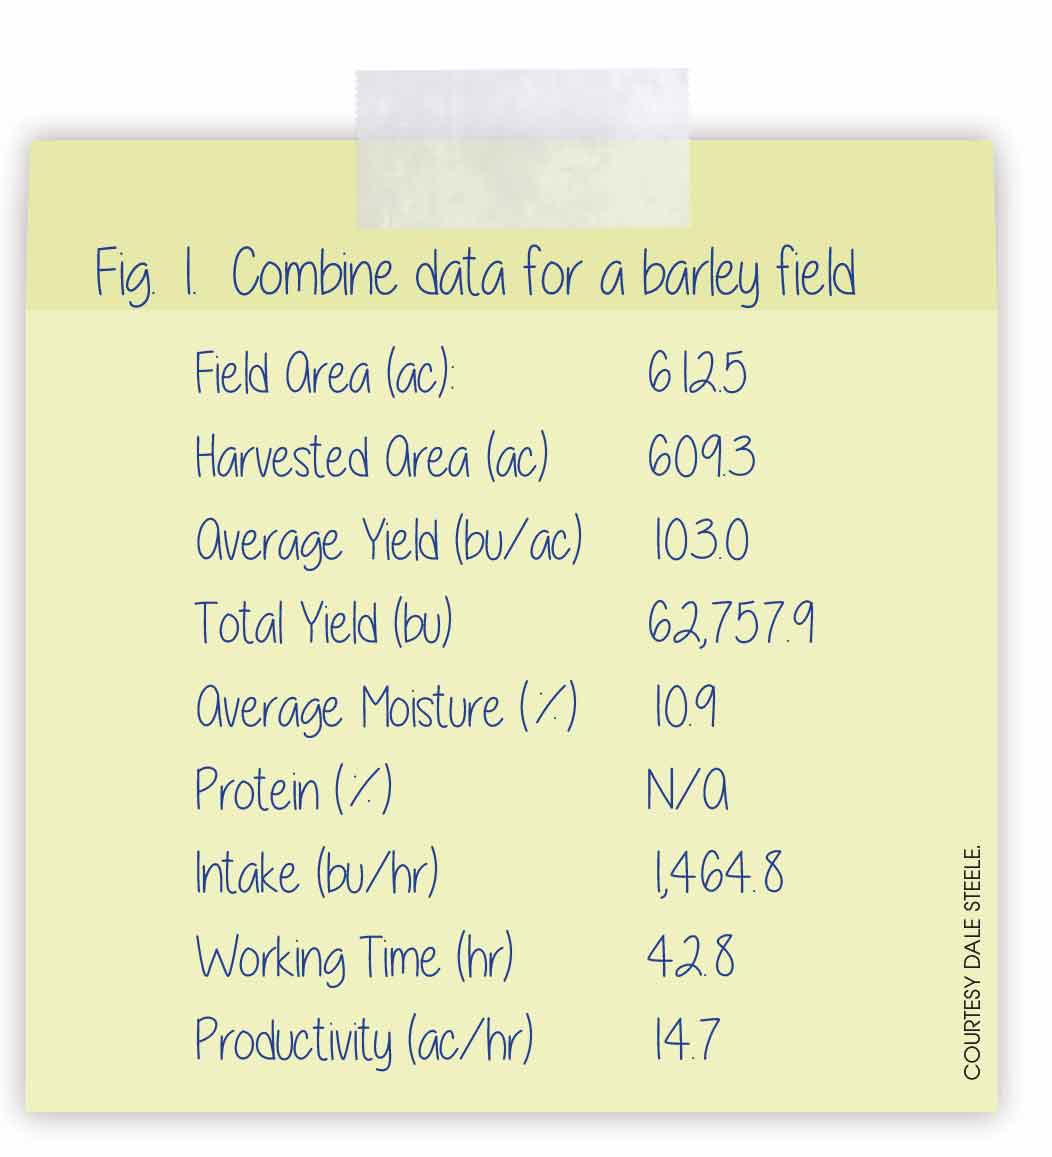
Crop yield is the measurement of crop production on a given area of land. It refers to the average of the field and is usually stated in bushels per acre or tonne/ton per acre. Average yield is the benchmark to compare with neighbours, assess management decisions and report for crop insurance. Average yield tells you only part of the story, since it is product of the area of maximum yields and the area of minimum yields within the field.
Prior to combine yield monitors, farmers relied on subjective assessments to determine the best management decisions for their geography. People tend to rely on subjective information from magazine articles, comments from neighbours and their judgment on what seemed to work last year. Field assessments and summer crop tours are also useful to compare and assess crop input options. Each of these is a source of information, but farmers really need accurate and measurable results to make informed decisions.
Years ago, I was launching a canola variety in a large strip-trial comparison with 10 other varieties. A top yielding variety was assigned as the “check variety” for the site. This check variety was replicated with a strip on each side of the field. My variety was located near the end of the site and it placed second when it lost the comparison by 4 bu/ac. While reviewing the raw data, I noticed a 6 bu/ac yield difference between the two strips of the check variety. From that moment on, I realized the impact that field variability can have on future management decisions.
Precision agriculture utilizes data and measurement techniques to enhance traditional decision-making. The data required depends on the questions you want answered. Yield data can consist of general information, such as historic average yields, or the average yield for a specific field. GPS coordinates can also define areas within a field where the combine collected yield data every second. Each type of data is valuable and can be useful to answer different questions.
Combine yield monitors
Combine yield monitors have been around for years, but many farms don’t take the steps to turn that data into valuable information. Logging yield data is easier than many people think. The combine operators must enter some variation of farm/field/crop type into the controller and indicate where to save the data. If farm/field/crop type is not entered, you may watch the controller display yields, but yield data is not saved. Many combine brands require a USB or compact flash card inserted into the yield monitor to store the data during combining. John Deere yield monitors have internal memory to store the data once the controller is set up.
Combine calibration
Many operators don’t calibrate the combine yield monitor during harvest. So even though they watch yields during 200 hours of harvesting, they know the data is not accurate. Inaccurate yield data can still be useful because it can be corrected from a known number. For example, the truck weights or bin measurement might confirm the combine yield monitor was +4 bu/ac high (on average). Newer yield monitors can reformat a prior field’s yield data to the corrected values from a calibration. Post-harvest data analysis can also correct inaccurate yield values. The final option is to just keep the inaccurate yield data knowing it is +4 bu/ac overstated. Either way, you can still make decisions with inaccurate data just like farmers have been making decisions for generations with no data at all. But a quick combine calibration can accurately capture the year’s final results.
GPS
I encourage farmers to install a GPS receiver on every combine to provide a GPS signal to the yield monitor, enabling advanced yield data analysis. Combines usually collect yield data every one to three seconds depending on the combine model. The GPS coordinates aid the merging of yield data from multiple combines and even multiple combine brands in a field. Auto-steer or GPS guidance is an option on combines, but a basic GPS receiver can provide a GPS signal to the yield monitor at minimal expense.
Do-it-yourself yield software such as APEX, AFS, SMS, FarmWorks and Yield Editor is available to process your yield data into yield maps. If you didn’t process your own yield maps by Christmas, consider hiring an experienced technician to do it for you. Yield data is like a Christmas present; you really should open it.
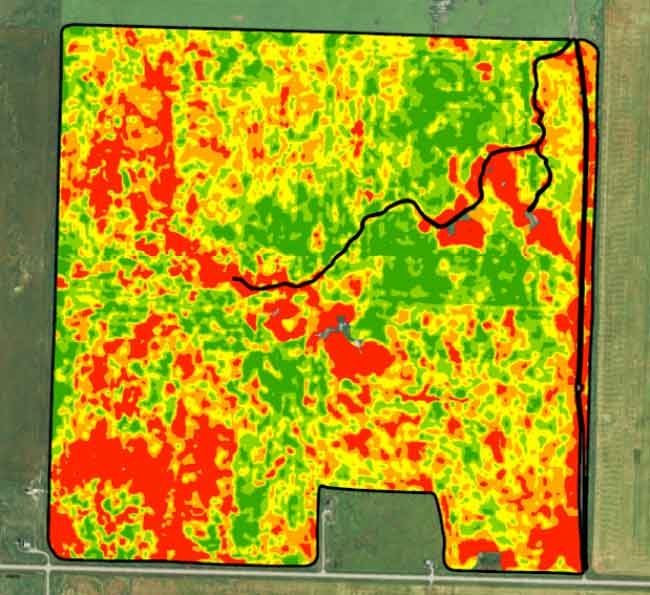
Yield maps
During harvest 2015, a new record wheat yield of 16.5 t/ha (245 bu/ac) was achieved in England. The media article didn’t say what the minimum yield of the field was, but a maximum yield of 342 bu/ac was mentioned. What future decisions can you make on this information? World records are interesting but without more information and yield maps to review, the information is not that useful.
Yield maps identify where your opportunities are and where improvements can be made. The farmer, the equipment operators and anyone involved with the farm can review each field after harvest to identify learnings prior to the next crop year. Was there a crop input comparison or unintended crop input comparison in the field? Perhaps there was no difference in yield from the additional crop inputs, or you identify a +5 bu/ac difference that was not noticed during crop scouting. Reviewing past years’ yield maps and/or satellite imagery can also identify chronic yield differences within a field that Grandpa could probably tell you a story about. From my experience, reviewing combine yield maps will always identify something interesting.
February 17, 2016 By Dale Steele P.Ag. Precision Agronomist
 Yield map Harvest is the time of year when farmers reap the rewards from a season of hard work