Features
Agronomy
Corn
Long-term phosphorus fertilization effects on crop yields and soil phosphorus
Evaluation of the residual effects from phosphorus (P) fertilization has been the subject of numerous studies in western Canada (Roberts and Stewart, 1987). Residual P is expected to build in the soil when the removal of P by crops is lower than the fertilizer or manure P applied.
November 7, 2008 By R.E. Karamanos J.T. Harapiak and G.A. Kruger
Introduction: Discontinuing P fertilization after 20 years of annual application of 27lb/ac P2O5 resulted in a significant reduction in barley grain yield, with losses of 21 percent where P had been applied in the seedrow, 12 percent where P had been banded with N, and 15 percent where P had been applied one-third in the seedrow and two-thirds banded. While minor benefits to residual soil P were measured from annual application, continued fertilizer P use was required to achieve optimum yields.
Evaluation of the residual effects from phosphorus (P) fertilization has been the subject of numerous studies in western Canada (Roberts and Stewart, 1987). Residual P is expected to build in the soil when the removal of P by crops is lower than the fertilizer or manure P applied. However, numerous studies have demonstrated that recovery of P by crops in the year of application is very low (Hedley and McLaughlin, 2005). Fertilizer P recovery remains low and can range from less than 10 percent up to 30 percent depending on soil, crop and management factors (Withers et al., 2005).
However, it has been argued that determining the percentage recovery of P as an estimate of fertilizer P recovery may be inappropriate, and some suggest a budget of inputs and outputs should be developed and related to changes in soil P status (Higgs et al., 2000). Obviously, that latter approach would lead to efficiencies close to 100 percent, since P losses from soil are minimal.
The objective of this study was to assess the residual effects from 20
annual applications of fertilizer P to a Black Chernozemic soil (Udic Boroll) in Alberta, and measure the impact on
succeeding crops that received no fertilizer P. The trial was established in the fall of 1981 at the University of Alberta, Ellerslie Experimental Farm, to assess methods of P placement. The experimental site was divided into two parts. Part A received a blanket application of 400lb/ac P2O5 in the fall of 1981 as triple superphosphate (0-45-0), and Part B received no P fertilizer.
A number of treatments were initiated in both parts on an annual basis, including (i) an unfertilized control, (ii) nitrogen (N) only treatment that received 72lb/ac banded N, (iii) a treatment that received 72lb/ac banded N and 27lb/ac seedrow applied P2O5, (iv) a treatment that received 72lb/ac broadcast N and 27lb/ac seedrow applied P2O5, (v) a treatment in which both 72lb/ac N and 27lb/ac P2O5 were banded (dual banding), and (vi) a treatment that received 72lb/ac banded N and 27lb/ac P2O5 split one-third in the seedrow and two-thirds in the band. Banded N and P (at a depth of five inches) and broadcast and incorporated N fertilizer treatments were applied in the fall of the previous year; seedrow placed P was applied at seeding time.
Phosphorus in all treatments was applied as triple superphosphate (0-45-0), whereas N was in urea (46-0-0) form. Fertilization in all treatments of both parts of the study was discontinued in the fall of 2001 and the experiment was terminated after the 2004 growing
season. Barley was grown in all except one year (1995, canola). Commencing in 2002, only treatment (vi) was fertilized with P at a rate of 27lb/ac P2O5 seedrow applied. All treatments other than the control still received 72lb/ac banded N according to the original schedule. Composite soil samples from zero to six inch depth of the control treatments were collected on an annual basis either in the fall after harvest and/or spring prior to sowing each year. Soil samples were analyzed for ‘available’ P using the bicarbonate (Olsen et al., 1954) method.
 |
 |
| Figure 1. Comparison of barley grain yields between control treatments of Parts A and B from 1982 to 2001 (enclosed regression between 1993 and 2001 excludes canola in 1995). | Figure 2. Total net uptake and ‘apparent’ P recovery after 20 annual applications of 27lb/ac P2O5 in the form of triple superphosphate (0-45-0). |
Detailed sampling of all plots of Part B and treatment (vi) of Part A (the one receiving 27lb/ac P2O5 in 2002 to 2004) was carried out in the fall of 2005 after a chemical fallow year. Samples were taken from zero to four inches and four to eight inch depths along a 16.4 foot transect crossing two rows in each plot. The transect was drawn at an angle, so that when projected on a line vertical to the direction of the seeding rows, the distance between sampling points was one inch.
Fourteen such sampling points were duplicated in each plot and the two corresponding sub-samples for each point were composited into one, thus resulting in 14 samples per plot per sampling depth. All sub-samples were analyzed for ‘available’ P using the bicarbonate method (Olsen et al., 1954). In the summer of 2006, Plant Root Simulator (PRS) probes (Hangs et al., 2004) were inserted on the row and in the middle of the inter-row spaces of the same plots where soil samples were taken in the previous fall. Four anion PRS probes were buried per plot at each of two depths (zero to four inches and four to eight inches). After 28 days, the PRS probes from each plot depth and treatment were retrieved, washed with deionized water, and analyzed for P as described by Hangs et al., 2004.
 |
| Figure 3. Barley grain yield loss resulting from discontinuing P application after 20 years of annual application of 27lb/ac P2O5 as 0-45-0. |
After the first 10 years of growing barley on both sites, no difference in the yields was observed between the two parts of the study where one part received the residual P fertilizer. However, the residual effects from the original 400lb/ac P2O5 had been exhausted after 10 years of barley
production (see Figure 1). This is corroborated by comparing the grain yields and soil test levels of the control treatments of Parts A and B.
A number of techniques have been utilized to assess fertilizer P use efficiency (FPUE). Most commonly, FPUE is estimated by comparing uptake of P by plants grown in a fertilized soil to that of an unfertilized control, also known as ‘apparent recovery’. Total uptake of P during the first 20 years of the experiment ranged from 682lb/ac to 736lb/ac P2O5 for the P treatments compared to 568lb/ac P2O5 for the treatment that had received N only. Hence, net uptake (uptake in any P treatment-uptake in control) ranged from 114lb/ac to 168lb/ac P2O5 (see Figure 2). Since a total of 532lb/ac P2O5 was applied, it resulted in an apparent P recovery (FPUE) of between 21.2 and 31.4 percent for the 20 year period from 1982 to 2001.
The lowest recovery rate was obtained when N was broadcast and incorporated and P was seedrow placed. This reflects the lower fertilizer N use efficiency (FNUE), as it has been demonstrated already that N fertilization results in increased P uptake and, consequently, higher P recovery in crops (Halvorson and Black, 1985). In spite of this, interruption of P fertilization in 2002 led to significant yield decreases with
average losses over a three year period (2002 to 2004) being
greater (21 percent) when 27lb/ac P2O5 was being seed-placed for the first 20 years, and lesser with one-third seed-placed and two-thirds banded (15 percent) and banded with N (12 percent) (see Figure 3).
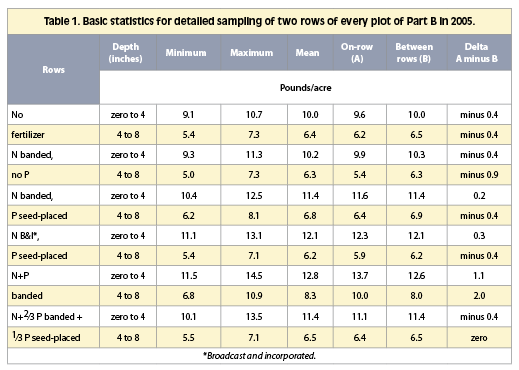
Soil P levels showed virtually no differences between ‘available’ P levels on the row (where P was placed) and in the inter-row spaces (see Table 1). The exception was at the four to eight inch depth of N+P banded treatment, in which P levels on the row were two parts per million greater than in the inter-row spaces, reflecting accumulation of fertilizer P at that depth. Lack of differences in the remaining treatments would appear logical, since the surface soil layer above the depth of banding was being disturbed and redistributed every year prior to seeding. Further, there was a difference of up to four parts per million on the row, and three parts per million in the inter-row spaces, of the zero to four inch layer between the P fertilized treatments and the unfertilized controls (see Table 1). These ‘available’ P levels in the zero to four inch layer are considered very low (McKenzie et al., 2003; Saskatchewan Agriculture and Food, 2006) to low (Manitoba Agriculture, Food and Rural Initiatives, 2001). Hence, a greater than 75 percent probability of response to P based on the above sources should be anticipated. However, differences in the extractable P levels of previous P fertilized treatments were not sufficiently wide to fully explain the observed yield losses.
 |
| Figure 4. Distribution of bicarbonate extractable P and P supply rates in the 72lb/ac banded N and 27lb/ac seedrow (SR) applied P2O5 (a) and both 72lb/ac N and 30lb/ac P2O5 banded (dual banding) (b) treatments. |
Four week (28 day) burial of PRS probes in 2006 measured major
differences in supply rates, hence P availability, based on management and P placement practices. The supply rates and bicarbonate extractable P levels of the N banded P seed-placed and N+P banded treatments are contrasted in Figure 4. Although distribution of bicarbonate-extractable P in the seed-placed P treatment was fairly equal over the 14 sampling points, supply rates were distinctly different between on-row and inter-row spaces (see Figure 4a). Supply rates on the row averaged 3.3µg/10cm2/28 days and those in the inter-row spaces were 24 percent greater at 4.1µg/10cm2/28 days.
Hence, in this treatment, PRS probes were able to isolate the depletion of P reserves on the row, since the position of the row remained fairly stable over the experiment, and the inability of the roots to reach the P reserves that were stored in the middle of the inter-row spaces. Conversely, supply rates in the banded treatments were significantly higher on the row (4.2µg/10cm2/28 days) compared to the middle of the inter-row spaces (3.3µg/10cm2/28 days) and reflected both higher accumulation of P in the band as well as possible translocation to shallower depths via biocycling (see Figure 4b). Supply rates greater than 3.5µg/10cm2/28 days are considered an indicator of sufficient P supply in the soil (Hangs et al., 2002).
 |
Barley grain yields obtained in the last year of the study were significantly
correlated with supply rates for on-row (r2 = 0.936), in the middle of the row spaces (r2 = 0.678) and when supply rates were combined into one per plot (r2 = 0.891) (data not shown). Corresponding correlations of barley yields with bicarbonate extractable P levels were also statistically significant, but lower (0.685, 0.670 and 0.684). Similar trends were obtained when the average 23 year yields were correlated with supply rates and bicarbonate extractable P levels (data not shown).
Residual P from long-term P fertilization was not sufficient alone to provide all the P requirements of barley grown in a monoculture system when P fertilization was discontinued after 20 years of application. PRS probes afford a satisfactory means of identifying point sources, as well as long-term trends of P fertilization, i.e., placement and long-term fertilization effects. The use of PRS probes allowed us to interpret 93 percent of variations in P removal by barley over the duration of the experiment.
Reprinted from Better Crops with Plant Food, with permission of International Plant Nutrition Institute (IPNI).