Features
Agronomy
Irrigation
Refining VRI prescriptions
Variable rate irrigation (VRI) is a great idea, but many practical questions remain. Researchers are working to answer these questions so Prairie irrigation farmers and agricultural service providers will be able to more easily and effectively adopt VRI.
May 30, 2017 By Carolyn King
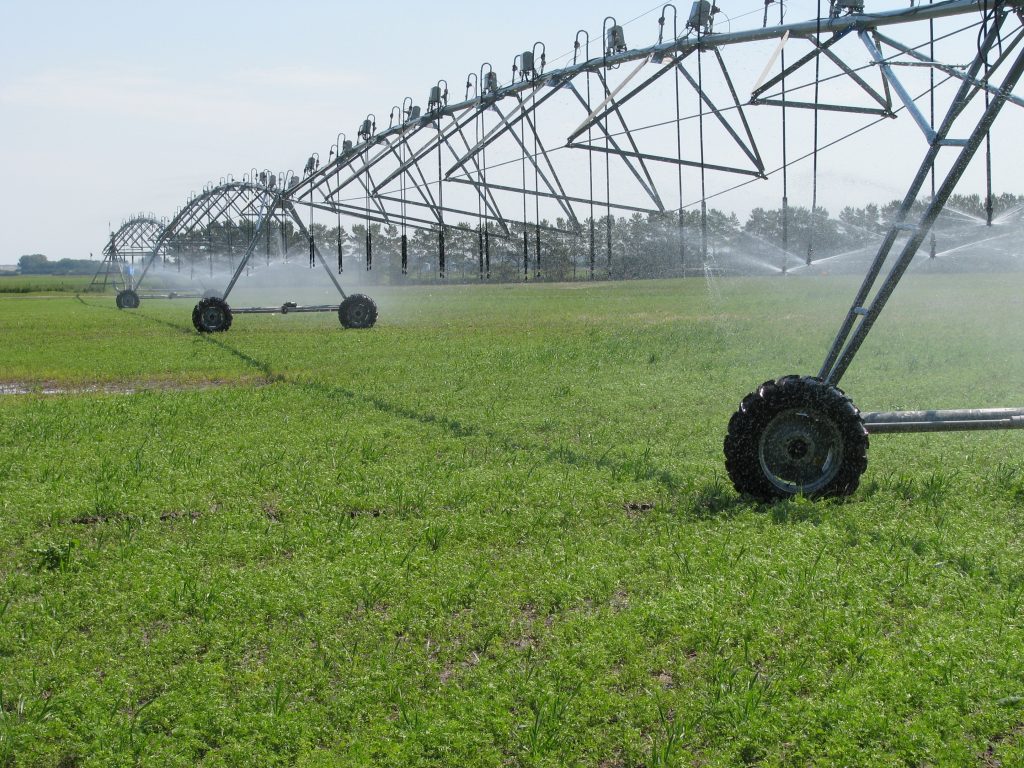 Researchers are evaluating different approaches to creating prescription maps for variable rate irrigation applications.
 “Traditional irrigation applies a uniform application depth over the whole field. As we know, rarely are fields uniform in terms of topography, soil texture and so on,” says Evan Derdall, a biosystems engineer with Agriculture and Agri-Food Canada (AAFC) in Saskatoon who is leading the research project. “By having the ability to vary the water applications across a field, you can try to create the ideal soil moisture content throughout the field to optimize crop growth.”
However, it’s challenging to create prescriptions that accurately meet the crop’s water needs, as those needs vary across the field and over the course of the growing season.
Derdall notes, “As variable rate technology has become more available in the marketplace, many agricultural service providers are applying their methodologies to variable rate irrigation prescription development. A lot of those methods are based on variable rate seeding and fertilizer applications. With fertilizer and seeding, the map is set at the beginning of the season. But with irrigation, water is very dynamic. It moves throughout the field and water needs change depending on crop stage, topography and soil texture, so we almost need to be updating the VRI prescription map continuously throughout the growing season.”
That type of continuous updating isn’t often done at present. “Typically farmers utilize variable rate irrigation simply by applying more water on the hill tops and less in the low areas because water tends to pool in low-lying areas,” Derdall says.
“So, we want to take VRI prescription maps further and see if we can better manage water throughout the field. We want to see if there is a way to make the very complex task of creating dynamic VRI maps a little simpler so producers and the service providers could better utilize the technology.”
Derdall’s project draws on field studies in Saskatchewan and Manitoba. He is working on the Saskatchewan study with Warren Helgason from the University of Saskatchewan. The Manitoba study is led by Alison Nelson with AAFC Winnipeg. Heather McNairn at AAFC Ottawa and Jarrett Powers at AAFC Winnipeg are also working on the research.
The project will bring together the data from the Saskatchewan and Manitoba studies, assess the value of various technologies for creating VRI prescription maps, evaluate the economics of VRI, develop recommendations for creating VRI prescription maps and conduct some training for producers and ag service providers.
The Saskatchewan study, which is funded through Saskatchewan’s Agriculture Development Fund (ADF), is mainly taking place at the Canada-Saskatchewan Irrigation Diversification Centre in Outlook, Sask. AAFC funding is enabling collaboration with the Manitoba study, which is taking place at AAFC’s research site near Carberry. (The study was also highlighted here.) In addition, two producers are participating with on-farm sites: one is in Saskatchewan and one is in Manitoba.
The Saskatchewan study started in 2016 and runs to the spring of 2019. “We are using the methods typically applied to variable rate fertilizer prescription maps, including EC [electrical conductivity] maps, yield maps and topography, to come up with a general VRI map and carrying it through the year,” Derdall explains. “And we are comparing that to some of the emerging technologies used for creating prescription maps over the growing season, including NDVI [normalized difference vegetation index] imagery, thermal imagery and passive microwave imagery.”
In 2016, the Saskatchewan study team collected detailed data on the field sites in the province and tested some of the technologies. The 2017 and 2018 field seasons will involve intensive work including: ongoing monitoring with the different technologies; converting the imagery into VRI prescription maps; and evaluating the effects of the different prescriptions on canola yields. The team will also be scouting the sites for things like crop disease and other problems that could influence the patterns seen in the imagery. As well, they will be taking soil moisture samples throughout the field and correlating these soil moisture maps with the different types of imagery to see which best represents the actual soil moisture in the field.
Canola was selected as the study crop in Saskatchewan for several reasons. “Canola is probably one of the most common irrigated crops in Saskatchewan. Also, canola poses a challenge with NDVI and possibly with thermal imagery. During canola’s flowering stage – an important time to keep water regimes up – NDVI tends not to work very well. NDVI senses the greenness of vegetation as an indicator of crop health, so if you’ve got a field of yellow flowers, it doesn’t translate very well,” Derdall says. “Also, my Manitoba colleagues who are providing me with some of their data are working with potatoes.” With information on both canola and potatoes, the project will cover two of the key irrigated crops on the Prairies.
Tools like an EM38 sensor or a Veris sensor collect EC data as the operator drives the sensor across the field. EC readings are usually a good indicator of soil texture, so an EC map is an alternative to detailed soil sampling and analysis for soil texture. However, EC readings are also affected by other soil characteristics. Derdall explains, “This type of sensor gives you inferred soil texture. But an issue that pops up with irrigated production is that this technology is also very susceptible to salt content in the field. When you are irrigating, you may or may not be introducing some salts into the field, so that can throw off your [soil texture] sensing capacity using that technology.”
These EC sensors also map the field’s topography and on-combine yield monitors create the yield maps. The layers of data on EC, topography and yields are then combined to create management zones for a VRI prescription map, based on an understanding of how the data layers relate to crop water needs and irrigation application rates. For example, Derdall says, “Usually you use variable rate fertilizer maps to apply more fertilizer in areas where you have higher crop yields. But for irrigation that may be counterproductive because the higher yields may mean the crop had sufficient moisture throughout the year, and the lower yields, probably on the hilltops, likely mean the crop lacked moisture and nutrients.”
To collect NDVI, thermal and passive microwave imagery, the research team is using drone-based and satellite-based sensors. “The nice thing about these remote-sensing approaches is you can take a snapshot of the field at a number of times throughout the year. With sensors like the EM38, you just have a snapshot at the beginning [of] the growing season,” Derdall says. The remote sensing options offer an opportunity to assess changing water needs during the growing season.
Like the EC, topography and yield data, the images from the emerging technologies need to be interpreted to figure out what they mean for irrigation applications.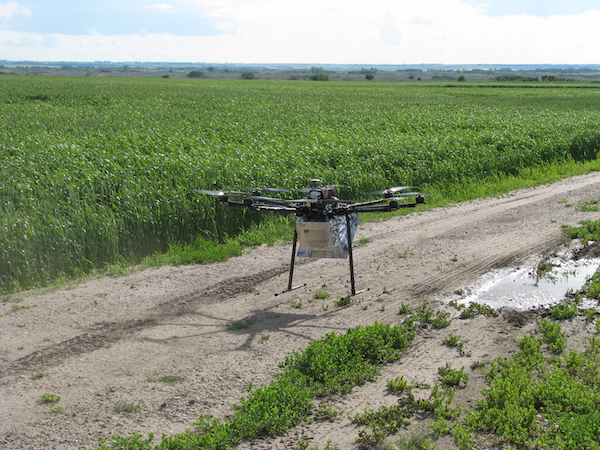
Photo courtesy of Evan Derdall.
Measuring crop cover
NDVI is a common index for measuring vegetation cover. The sensor measures different wavelengths of light being reflected from an area and uses that information to estimate how much green vegetation is present. Derdall explains, “NDVI imagery is a function of crop health. With modelling, we are trying to infer that a healthier crop uses more moisture. However, if a crop is struggling, it may actually be due to various factors, like a disease or insects, [low nutrient levels] or some other problem, not just moisture.”
Thermal sensors measure infrared light emitted from the landscape. “Thermal imagery, which we are going to start testing this year, tends to have a better correlation to plant stress [than NDVI imagery]. The idea with thermal imagery is that a plant with sufficient moisture can evapotranspiratemore and so it can cool itself down and won’t be as hot as a plant stressed by low moisture,” Derdall says.
Passive microwave radiometers measure naturally emitted microwaves from the earth. He notes, “Passive microwave imagery relates to some work with Heather McNairn’s group on the SMAP [Soil Moisture Active Passive] project. There’s a model that correlates the surface soil moisture to emissivity readings that we’re capturing with these passive microwave sensors.”
One of the difficulties with interpreting passive microwave imagery for VRI prescriptions relates to how deep the sensor can detect soil moisture and what that means in terms of the amount of water in the crop’s root zone. For instance, Derdall says, “We have learned that passive microwave imagery tends to measure the soil moisture in the top couple of inches in loamy soils. But in a very sandy soil, it is actually sensing quite a bit deeper because it can move through sands better.”
Workshops in 2019
“One of the reasons we got into this research was that many of the farmers we were dealing with would get these prescription maps and follow them, but based on their own historical knowledge of the field, they recognized that the prescription didn’t make sense for water applications in some parts of the field,” Derdall says. “So, we are trying to develop that knowledge and understanding so farmers can better interpret the imagery and apply it to their situation.”
Based on what Derdall and his project team learn from the Saskatchewan and Manitoba studies, they will be creating training materials on VRI prescriptions. They plan to develop recommendations outlining how to use each of the technologies to map a field and how to interpret the resulting imagery to create meaningful VRI prescription maps. Derdall notes, “Each of the sensor technologies will work to some extent; one might be better than another, but there are cost-benefit trade-offs.”
As well, the researchers are planning to develop a decision-support tool to help farmers assess whether VRI would be economical for a particular field. Derdall explains that the equipment for applying variable rate irrigation is still quite expensive and can range from about $20,000 to $40,000. “So, for example, if you have a uniform, flat field, then VRI doesn’t make sense,” he says.
The project team hopes to hold several VRI prescription map workshops for farmers and ag service providers in 2019 – possibly one in the Lethbridge area, one in the Outlook area, and one in the Carberry-Brandon area. Both ADF and AAFC will be providing funding for the workshops.