Features
Agronomy
Diseases
Improving sclerotinia prediction
One of the most difficult decisions canola growers face every year is whether or not to spray a fungicide for sclerotinia stem rot. Although various tools have been developed to help growers assess sclerotinia risk, the disease remains hard to predict. So two projects are underway to improve sclerotinia forecasting.
One project involves a better method for detecting sclerotinia infection on canola petals as a way to predict disease risk. The other project is developing a weather-based risk assessment method. The projects are funded through a joint initiative of Agriculture and Agri-Food Canada (AAFC) and the Canola Council of Canada.
“With sclerotinia, the decision to spray needs to be made as the crop is coming into flowering, before you see any symptoms,” explains Dr. Kelly Turkington, a plant pathologist at AAFC’s Lacombe Research Centre. “It’s too late to spray once you see infection on the plants. So you have to consider other factors that influence sclerotinia risk when deciding whether to spray.”
Several tools already exist to help growers assess those other factors. One is the Canola Disease Scouting and Risk Assessment Card available on the Canola Council’s website. The card has information on sclerotinia’s disease cycle and a checklist for making sclerotinia spraying decisions. Using the checklist, the grower answers questions about the crop, the environment and the pathogen to assess the risk for the disease.
“When I first started using the checklist, it really helped me understand sclerotinia and the factors that contribute to it,” says Emile deMilliano, an agronomist with Viterra in Alberta. He has been dealing with sclerotinia since it first became a problem in canola in the early 1980s.
“These days, several items on the checklist can usually be automatically checked off. For example, the crop rotation question is going to be rated ‘high’ because we’re in tight rotations.” As well, the crop density question will probably be rated ‘high’ because most growers are aiming for yields over 40 bushels/acre; a denser canopy tends to be more humid, which favours the disease. deMilliano also doesn’t bother with the checklist’s question about the number of apothecia, the fungus’s little mushroom-like fruiting structures. “I don’t look for apothecia any more. If there’s been reasonable crop growth and reasonable moisture, those mushrooms are very likely to be there.”
Several agencies have provided regional sclerotinia risk maps over the years. “These types of maps provide an idea of where the risks are higher on a regional basis, but to make a decision on spraying an individual field, you need to look at that field,” says deMilliano.
Another tool is petal testing using agar plates to determine the percentage of canola petals infested with the fungus. Petal infection is a crucial stage in the development of sclerotinia, so the number of infected petals provides an indication of the disease’s risk level.
Turkington was involved in the development of this test when he was a student at the University of Saskatchewan. The test is now commercially available as a kit. “The test is very useful for identifying fields that you don’t need to spray, and it can also be useful to determine fields where a spray should be considered,” he says. “The challenge, though, is that you need to also look at the environment and the host to improve that forecast.
“One of the criticisms of the agar plate test is that it takes too long – from three and a half to five or even six days. It also involves some work in terms of plating out the petals and requires a trained person to determine if any fungi on the plate are the sclerotinia fungus. So if you’re a consultant with 25 clients and each client has anywhere from 500 to 5000 acres of canola, it is too time consuming,” adds Turkington.
deMilliano worked with the agar plate tests about 10 years ago for several years. “The biggest challenges were that the test is very tedious and time consuming. And timing is very crucial – you need to do the test close enough to when the grower might spray but not too late.”
Typically, fungicides for sclerotinia need to be applied between 20 and 50 percent bloom, with the optimum spray time at about 30 percent bloom. deMilliano advises growers to make their spraying decision by 30 percent bloom. With only about one week from the start of flowering to 30 percent bloom, growers need timely information on sclerotinia risk levels.
Improving petal testing
Turkington is collaborating with Dr. Stephen Strelkov at the University of Alberta on the project to improve the petal test. They are co-supervising master’s student Barb Ziesman, who is working on the project, and they are working closely with deMilliano.
The project involves using molecular techniques, called quantitative PCR, to detect sclerotinia inoculum on canola petals.
The researchers already have the test up and running. “The test is really sensitive, and we’re able to quantify sclerotinia DNA on the petals,” says Ziesman, who notes they are currently adding an internal control to the test procedure to ensure that the test doesn’t generate any false negatives or false positives.
The test takes about five or six hours, so it’s much faster than the agar plate method. There’s also less likelihood of human error with the PCR test. “The primers we use for our test are specific to sclerotinia; we have tested it against the other types of fungi, and there is no cross-detection,” notes Ziesman. “But with the agar plate method, a lot of the fungi in canola fields are white like the sclerotinia fungus, so it takes a trained eye to identify it on the plate, and there is the chance of overestimating and underestimating the amount of sclerotinia.”
The researchers’ next step will be to see how the PCR results relate to actual disease levels in the field. Over the past three summers, they visited about 75 canola fields throughout Alberta, Saskatchewan and Manitoba in each year, and collected 40 flowers from five sample sites per field. Also, they went back at the end of the growing season and determined the final disease incidence in each field.
In the coming months, they’ll be extracting the DNA from the collected samples, and correlating the final disease levels with the PCR results. Then they’ll use that information to identify ranges of petal infestation that indicate low, moderate and high risk levels for the disease. One confounding factor in some fields is that they were sprayed, so the disease level may be lower than expected.
A canola grower could use that risk information along with other factors – such as whether the crop canopy is staying wet into the afternoon, whether the forecast is for showery conditions, if the canola hybrid is very susceptible to sclerotinia, and if the crop yield potential is high – to decide whether to spray.
Turkington notes, “The idea ultimately is that this quantitative PCR test could be used by private sector seed testing labs, providing another revenue stream for them. Being commercial labs, they would have the experience, staff and processes in place for handling and testing large quantities of plant material, and they could provide a fairly rapid turnaround for the test results.”
Weather-based risk assessment
The other project is working towards a weather-based method for determining the risk of sclerotinia. Dr. Paul Bullock of the University of Manitoba is leading this project with co-investigator, Dr. Dilantha Fernando of the University of Manitoba, and graduate student Reanne Pernerowski.
In this project, the researchers collected a wide range of field data in 2011 and 2012 at Winnipeg and Carman, Manitoba. They set up fairly large plots to try to create a microenvironment similar to that found in a typical canola field. They inoculated the soil with sclerotia to ensure the fungus was present in the plots. Then they compared three canopy thicknesses: low (using low seeding rates and low nitrogen rates); medium (average seeding rates and average nitrogen); and high (high seeding rates and high nitrogen).
Over the course of each growing season, the researchers measured the environmental conditions under the canopy, such as humidity, temperature and soil moisture. As well, they measured the number of sclerotinia spores in the air above the plots, determined the amount of disease on the petals, and assessed disease levels in the canola stems as the crop moved toward maturity. They also collected standard weather data at the sites.
The researchers hope to be able to correlate the disease levels with the standard weather data, and create a decision support system in which a grower could use weather data from a nearby station along with his own field’s crop density and stage information to predict its sclerotinia levels.
They are now sifting through all the data to look for the critical factors leading to severe sclerotinia levels. “Whether we’ll have enough data to build a full risk model or whether we’ll just be able to set some critical thresholds or something like that, remains to be seen,” says Bullock. “We would like to fill as many knowledge gaps about sclerotinia risk as possible with the data that we have collected during this study.
“There is tremendous interest in having a reliable weather-based means for calculating the local risk of sclerotinia in canola,” he adds. “If we can get a little better idea of the disease’s risk levels, it could really help canola growers to decide when it’s worthwhile to spray, which would be better for canola production and for the environment.”
deMilliano says, “Hopefully as we continue to work on finding more and better tools for our toolbox, we can give farmers a better idea of the potential risk for sclerotinia.”
March 27, 2013 By Carolyn King
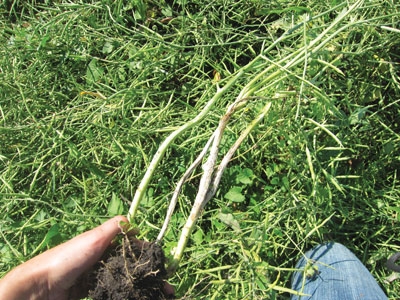 Sclerotinia symptoms in canola include bleached-looking stem lesions that cause the stems to become brittle and shatter easily. With sclerotinia