Features
Business & Policy
World Outlook
Global wheat production and fertilizer use
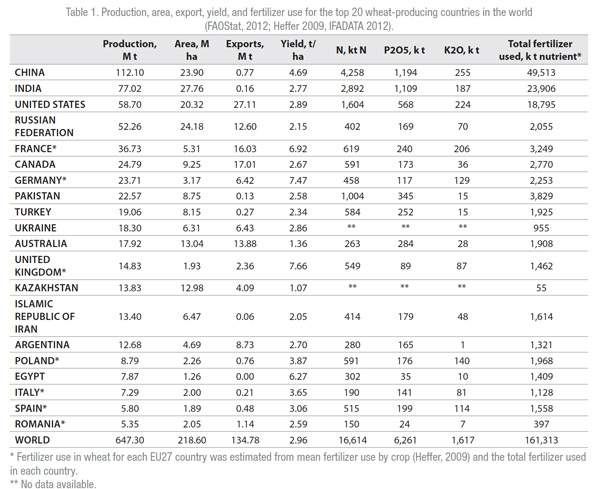
Global production of the major cereal crops of wheat, corn, and rice is 647 million tonnes (M t), 814 M t, and 441 M t, respectively (FAOStat, 2012). However, a large proportion of the corn crop is used for feed and fuel, while 93 percent of rice is consumed in the country where it is produced. Wheat is one of the most important food crops in the world, providing 20 percent of humanity’s dietary energy supply and serving as the main source of protein in developing nations. There was around 135 M t traded annually from 2006 to 2010, 71 percent of which was sourced from the United States, France, Canada, Australia, Russia and Argentina.
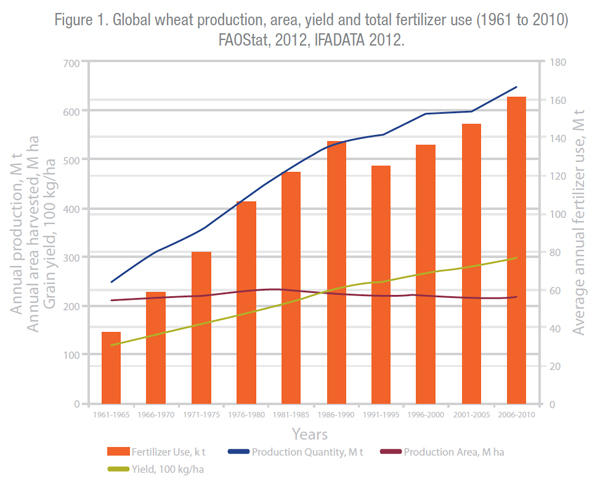
The demand for wheat follows rapidly growing populations and is expected to increase by 60 percent in the third world by 2050. Over the past 20 years, the average growth in wheat production has been around 1.0 percent per year (Figure 1), but that is considerably less than the 3.3 percent annual increase between 1960 and 1990, the time of the Green Revolution. This production increase has come from a constant production area of around 215 M ha. So production increases have been largely due to higher grain yields (Figure 1). To satisfy the growing demand for wheat, annual production increases need to be closer to the rates observed following the Green Revolution (Figure 1). While some of this increase in production will be achieved using improved genetics, the rest will need to come from better agronomic practices, so that the gap between potential and actual yields becomes smaller.
Historical production (1961 to 2010)
Since the period 1961-65, annual global wheat production increased 2.6-fold until 2010. From 1961 to 1980, the Soviet Union produced around 24 percent of the global wheat supply averaging just over 80 M t per year (Figure 2). The United States was the second largest wheat producer during that period, averaging 13 percent world production share (44 M t per year). In the 1980s, China gained, and has continued to hold, the greatest share of world wheat production, averaging 112 M t from 2006 to 2010 (Figure 2). Other significant increases in production share over the last half century occurred in India and Pakistan, while the dissolution of the Soviet Union still left Russia as the largest wheat producer among the former Soviet Union countries. The greatest single-country decreases occurred in North America with the United States and Canada shares dropping 32 percent and 38 percent, respectively (Figure 2). Out of 123 wheat-producing countries, approximately 70 percent of world wheat production is currently located in the top 10 countries represented in Figure 2 and 85 percent is in the top 20 countries.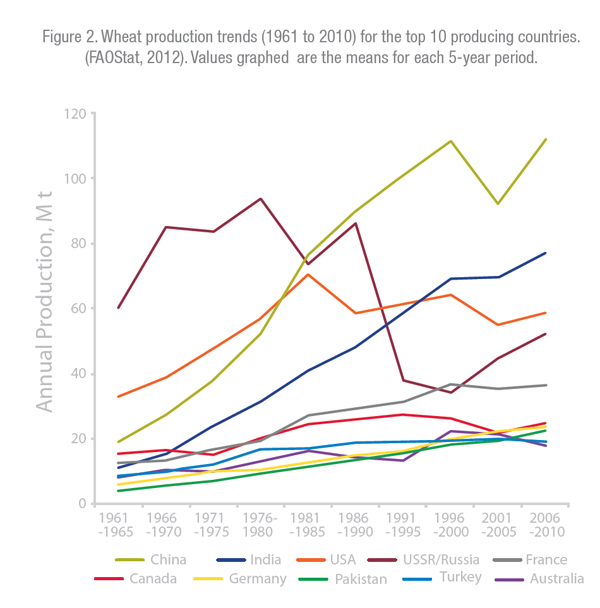
Production area
The top 10 wheat-producing countries also contain nearly 70 percent of the wheat area (144 M ha) in the world. This percentage has been consistent since the end of the USSR in the early 1990s. Since 1995, wheat area has increased most in Russia (2.7 M ha), Australia (1.6 M ha), and India (1.2 M ha) although there can be quite large changes in area planted between years due to seasonal and financial conditions. The increase in total wheat area in Russia since 1996 corresponds to an increase in the percentage of total crop area planted to wheat over the same time period, suggesting this increase is likely a result of wheat substituting for other crops. Australia also shows a slight increase in the percentage of crop area in wheat. Total crop area there increased by 2.2 M ha between 1996 and 2010, mainly as land that was previously either in permanent pasture or in rotation with crops brought into wheat production, with a consequent significant decline in sheep numbers. The additional 1.2 M ha of wheat in India is also likely a result of new land being cropped, as the percentage of total crop area allocated to wheat has not changed in the past 15 years. Germany added 400,000 ha of wheat over the past 15 years, which is small relative to total wheat area, but represents a 15 percent increase in wheat area in the country.
The largest decreases in wheat area during the same time period occurred in China (-5.1 M ha), United States (-3.3 M ha), Canada (-1.9 M ha) and Turkey (-1.2 M ha) (Figure 3). China, United States and Canada all had corresponding drops in wheat area percentages indicating crop shifts, while in Turkey the percentage of total crop area growing wheat did not change, reflecting a reduction in total crop area.
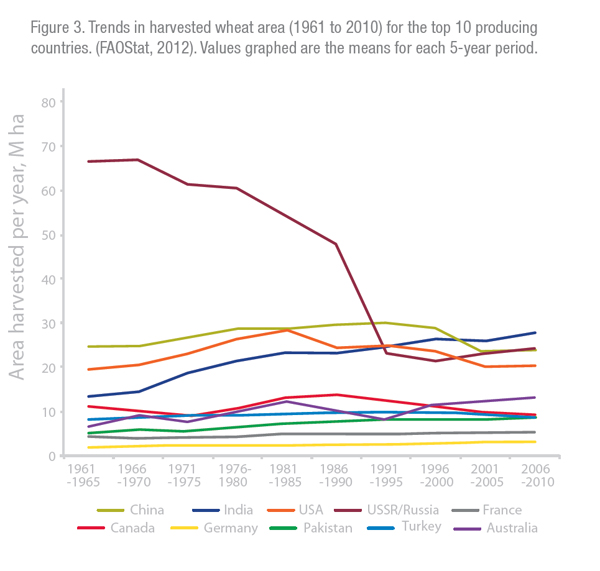
These changes in wheat area can explain, at least in part, the increases observed in overall production in India, Russia and Germany, and the decreases seen in the United States and Canada.
Grain yield
Changes in total wheat production over time, not related to changes in area, are likely a result of changes in grain yield. Global wheat yield doubled from 1.2 t/ha in 1961 to 2.4 t/ha in 1990 (Figure 1). Yield has continued to increase but at a slower rate, moving from 2.4 t/ha in 1990 to 3.0 t/ha in 2010 (Figure 1). The progress in wheat yields for the 10 top-producing countries is shown in Figure 4. The countries with the highest wheat yields among the top 10 producers have always been Germany and France. However, in the last decade, yield gains in Germany have slowed considerably and yield has declined slightly in France. Yields in China have increased at approximately the same rate as those in Europe over the past several decades and have continued to increase over the last 10 years. These large and consistent yield gains explain how Chinese production has continued to increase despite a significant reduction in wheat-producing area over the past 15 years.
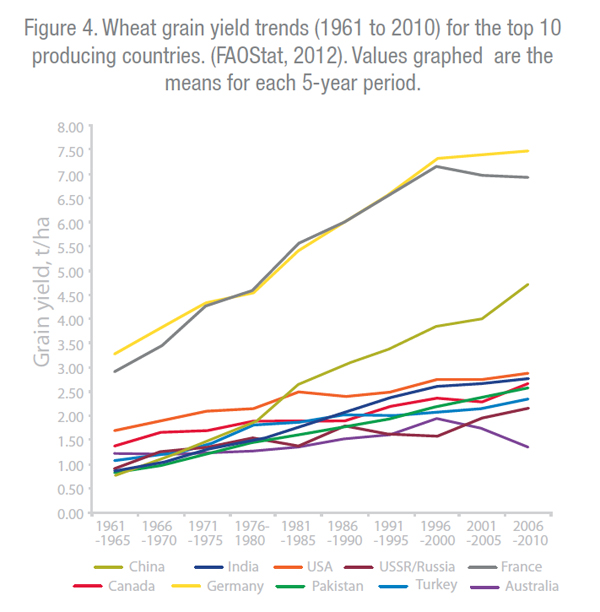
The average grain yield in Canada has also increased rapidly in the last decade; but of the top 10 wheat producers, only Germany, France and China have grain yields above the global average (Table 1). Grain yields in Pakistan, Russia, and Turkey are rising to at or near the global average of one percent annually, but are still at least 0.5 t/ha below the global average. Nonetheless, these yield gains have been enough to contribute to overall production increases in Pakistan and Russia, and kept production stable in Turkey despite reductions in the wheat growing area. Yields in India and the United States are near the global average of 3.0 t/ha, but growth rates are well below one percent per year. Due to a 10-year drought in Australia, yields have fallen to around 2.2 percent per year since 1996 to 2000. This fall helps to explain the drop in overall production in Australia despite recent increases in wheat area.
Fertilizer use in wheat
The quantity of fertilizer (total N, P2O5, K2O) used in wheat by the top 10 producing countries is approximately 18 M t (Table 1). Total annual fertilizer use for all crops has risen from 37 M t of N+P2O5+K2O in 1961-65 to 161 M t in 2005-09 (Figure 1). Since 1990 the consumption of fertilizer has risen for all crops and this is also likely to be the case for wheat, although the only data on fertilizer use by crop were released in 2009. Wheat-growing consumes around 15 percent of the total nutrients used, and 83 percent of the fertilizer used on wheat is applied in the top 10 wheat-producing countries.
In the period between 1991 and 1995, France and Germany began reducing fertilizer use and currently apply 34 percent and 23 percent less, respectively, than amounts used in the early 1990s (Figure 5). Australia has also reduced fertilizer use in wheat by 18 percent since 2000. The greatest increases in fertilizer use have occurred in India, Pakistan, Russia and China – all of which have increased use between 40 and 46 percent in the past 15 years (Figure 5). Fertilizer use in Canada and Turkey has been fairly stable for the past several years, and use in the United States has declined by six percent since the period 1996 to 2000. Without knowing use patterns in each crop it is not possible to define which crops have had use rates lowered.
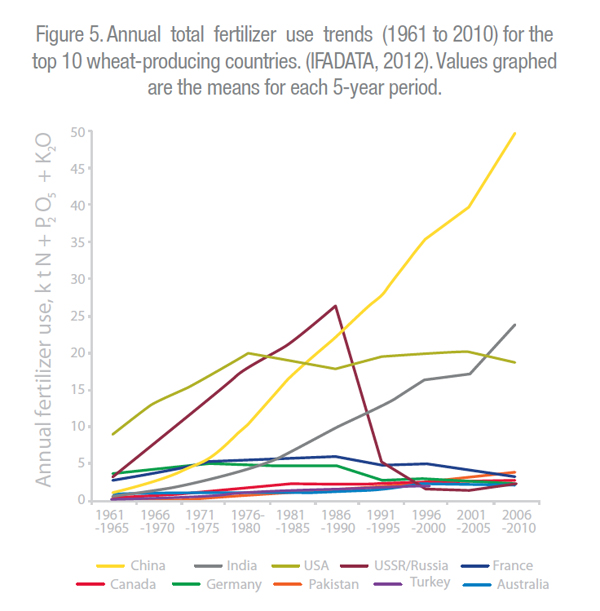
In the cases of China, Pakistan and Russia, the timing of the yield increases compared with the timing of increases in total fertilizer use coincide, indicating the significant role good nutrition plays in sustaining wheat yields. However, a relationship between increasing fertilizer use and subsequent increases in wheat grain yield is no indication that the current fertilizer management in these countries is at an optimum. Fertilizer rate is only one component of 4R Nutrient Stewardship, which is applying the right nutrient source, at the right rate, at the right time and in the right place. The 4R’s are interdependent and if one is wrong, none of the others can be right.
Conclusion
Increased yields rather than increased area sown has been the main factor behind the increase in wheat production. A range of interventions including the increased use of fertilizers has supported this trend. Increase in fertilizer use mirrors the gains in productivity, although to maintain production it will require continual review of nutrient inputs. The challenge will be to ensure that future growth in food production is met by careful and targeted use of fertilizers.
Dr. Phillips is Director, IPNI Southeast US; Dr. Norton is Director, IPNI Australia and New Zealand. Reprinted from Better Crops with Plant Food, with permission of International Plant Nutrition Institute (IPNI).
March 27, 2013 By Steve Phillips and Rob Norton
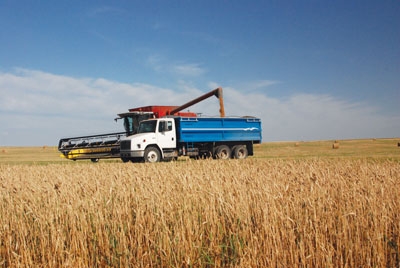 Gains in global wheat production have been linked to increased fertilizer use. Wheat is one of the most important food crops in the world.