Features
Agronomy
Fertility and Nutrients
Fertilizing after a drought
What are the considerations and options?
April 18, 2022 By Bruce Barker
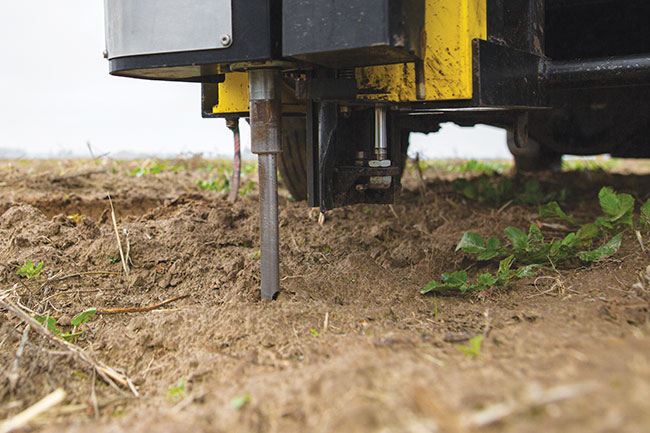 Soil testing will help determine the levels of leftover nutrients from the 2021 drought. Photo by Slavko Sereda.
 The drought of 2021 leaves a lingering hangover for 2022. Reduced crop growth and nutrient uptake during the growing season. Late season crop regrowth. Dry subsoil moisture going into the winter. What are the considerations and options going into the spring of 2022?
“There are two issues that need to be considered going into 2022. The effect of dry conditions from 2021 on crop growth, and the high price of fertilizer,” says Rigas Karamanos, a soil scientist Calgary. “These both have implications on fertilizer decisions this coming spring.”
Karamanos says the drought of 2021 meant poor crop growth, reduced nutrient uptake, changes in nutrient cycling processes in the soil, and increased nutrient variability across the landscape.
Abnormal nutrient status
The reduced crop growth in 2021 resulted in less nutrient uptake, especially nitrogen (N). Karamanos says that not only did the poor crop take up less nitrogen, but the lack of moisture could also mean that there was little nitrogen movement in the soil. As a result, soil nitrate tests are showing higher N fertility in the fall of 2021, and some of that N could be stratified in the top six inches.
Soil test data from Agvise Laboratories dating back to 1986 highlights the higher levels of soil nitrate-N following a drought. The years 1988 through 1990 were drought years, and had very high soil nitrate-N test levels of more than 107 lbs. nitrate-N per acre in the zero- to 24-inch depth. This compares with more “normal” year averages of 40 to 50 lbs. nitrate-N and around 30 lbs. nitrate-N in wet years around 2010. For 2021, soil nitrate-N levels were averaging around 63 lbs. nitrate-N per acre.
Another impact of the dry soil conditions is that there can be a decrease in soil pH and an increase in salts that is reflected in an increase in electrical conductivity (EC). This can result in an increase in soil test phosphorus (P). Research conducted by Karamanos found that soil test P could be 12 pounds per acre higher in dry years compared to moist years.
“The soil test results will correct over time as soil moisture returns to normal, and the P availability could change during the growing season,” Karamanos says. “So don’t be fooled that P is persistently higher.”
Soil test as the basis for fertility plans
At the University of Saskatchewan, soil scientist Jeff Schoenau says assessing what is in the soil is more important than ever, because of high fertilizer prices and high soil nutrient availability. The drought conditions, though, means that several cautions are in place for soil testing.
The first is that nutrient concentration will vary on both a micro and macro spatial scale, both horizontally and vertically. On the micro scale, research by master’s student Blake Weiseth in 2014 looked at how phosphorus availability could vary over just a few centimeters as affected by residual fertilizer P in the seed row. In the fall after harvest, Weiseth took blocks of soil and sampled for soil test P in the old seedrow and five- and 10 cm out from the seedrow horizontally. He also sampled at one-, four-, seven- and 10-cm depths.
Weiseth found that at seven- and 10-cm depths, soil test P was lower and quite similar across the horizontal samples. The big difference was at one- and four-cm depths in the seedrow. Soil test P in the old seed row was much higher, in some cases double to quadruple the levels found further out from the seedrow at these shallow depths in the seedrow.
“The research showed that we need to make sure to account for residual unused P in bands and in the seedrow when soil sampling,” Schoenau says.
Schoenau says that on a microscale, to reduce the variability to less than 10 per cent, taking soil samples across the seedbed to make a composite sample that includes the fertilizer bands, seed rows and the areas in between to adequately represent the proportions they occur in the field is necessary. On a macro scale across an entire field, separation into zones and taking more samples from each zone is desirable under conditions of high variability such as where patches of volunteer crop exist within a field.
With many fields already soil sampled during the fall of 2021, Schoenau says that soil fertility could change come spring depending on the nutrient and conditions influencing retention. Much of the residual available soil N is typically in the nitrate form after harvest, and could be susceptible to leaching or denitrification losses in the spring if wet conditions develop. Sulphur (S) may also have leached lower in the soil profile. In these cases, he suggests re-testing a few fields, especially in lower landscapes, to see if N availability changed. For nutrients like P and potassium (K) which are immobile and not susceptible to leaching or gaseous loss, the nutrients status will not likely have changed much from fall to spring.
Karamanos says that soil tests should be viewed as a guide and not gospel. He says that soil test results after the drought will likely show higher levels and lower fertilizer recommendations than normal.
“Be leery of zero fertilizer recommendations because of greater variability in nutrients and soil test values,” Karamanos says. “And be leery of increased P recommendations.”
Karamanos is developing a tool to calculate the N fertilizer rate of return. Fertilizer cost, application rate, soil test values, projected crop yield and price, and expected moisture can be plugged into the spreadsheet, and expected net returns are calculated. It will posted at the Alberta Wheat and Barley website. He has also developed a calculator specific to Manitoba, and it can be found on the Manitoba agriculture website at gov.mb.ca/agriculture/crops/soil-fertility/nitrogen-rate-calculator.html
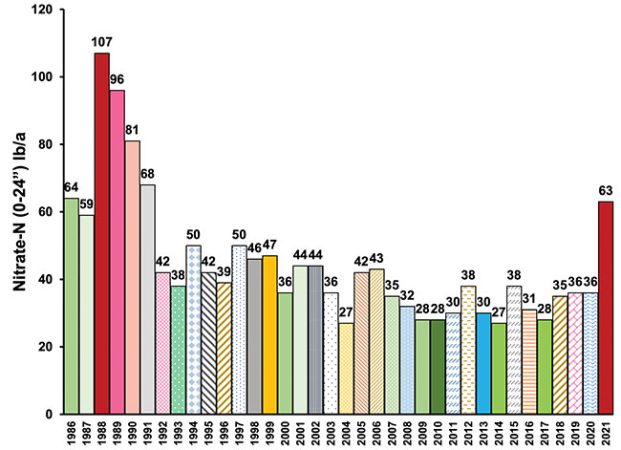
Average soil nitrate following wheat in Saskatchewan and Manitoba.
Pulses grown on soils with high N fertility will not fix much N
A major benefit to growing pulse crops such as pea, lentil, chickpea and faba bean is that they can obtain up to 80 per cent of their nitrogen from the atmosphere through biological fixation by the rhizobium bacteria in nodules on their roots. This contribution is maximized under low soil available N and good growing conditions. Schoenau says that fields testing high in available nitrate-N are not good candidates for a pulse crop. He says N fixation will be reduced because the plants will use inorganic forms of N in the soil rather than providing energy to the rhizobia bacteria to carry out the N fixation.
Schoenau says that a general rule of thumb is that when soil available N plus fertilizer N is around 30 pounds N per acre in the zero to 12 inch depth, N fixation starts to be reduced, and more than 50 pounds of N will result in a major reduction. High N fertility can also cause excessive vegetative pulse growth, which can result in increased disease and maturity issues.
“When a field has high N fertility, you are losing the benefit of nitrogen fixation with pulse crops. With the high price of fertilizer these days, I would recommend growing a non-pulse crop on those fields if possible,” Schoenau says.
What about that fall regrowth?
In some areas of the Prairies, fall precipitation resulted in regrowth of the crop, especially canola. In some cases, canola grew to the flowering stage before fall frosts terminated growth.
Schoenau conducted research in 2009 that looked at N and P uptake by wild oat. Nutrient uptake was fairly low, at 12 pounds N per acre and 2.3 pounds P2O5 per acre at two weeks. After two weeks uptake took off, and by eight weeks the wild oat plant had taken up 108 pounds of N, and 23 pounds of P2O5 per acre.
The research also looked at nutrient recovery by wheat from the dead wild oat residue. Very little N was recovered from the wild oat plant above ground residue. In the first two weeks, five to 10 per cent of the N was recovered, but little after that going out to 10 weeks. For P, 85 per cent was recovered by wheat plants from wild oat residue that was one week old. In two-week-old residue, that had dropped to 33 per cent, and after three weeks, the percentage recovery dropped to six per cent or less.
“Significant portions of phosphorus in young crop residues exist in soluble forms that are readily released by and do not require extensive microbial decomposition to become plant available,” Schoenau says.
During the fall of 2021, some of the worst regrowth was found in harvested canola fields. With an early harvest and fall rainfall, some of that canola reached the flowering stage. While this regrowth wasn’t as vigorous as a canola crop, the nutrient uptake would have been significant.
Research in 1998 at AAFC Melfort by Adrian Johnston looked at nutrient uptake by canola. His research found that from emergence to five-leaf stage, canola took up 0.77 pounds N per day, and 0.14 pounds P2O5 per acre per day. From the five-leaf stage to first flower, the canola took up 3.85 pounds N per acre per day, and 0.66 pounds P2O5 per day.
This research didn’t look at nutrient recycling, and it is safe to say that most of the nutrients will be recycled back into the soil unless they were baled or grazed, but may not be released in time for the 2022 crop to benefit greatly, especially for early crop nutrition.
Another indication of the amount of nutrients taken up by regrowth comes from crop nutrition specialist John Heard with Manitoba Agriculture. He and Dane Froese, provincial oilseed specialist with Manitoba Agriculture, analyzed a canola field for nutrient content. The canola crop had been written off by crop insurance but the poor growth was not terminated. Fall rains brought the crop back to life and it started to grow again, reaching flowering. Their assessment found that there was 1.9 to 2.6 tons per acre of canola biomass. That biomass contained an average of 160 pounds N, 30 pounds P2O5, 130 pounds of K2O, and 40 pounds of S per acre.
“Using experiences from cover crop studies, we often found that there was a yield drag and it is likely that much of this N will not be available for next year’s crop,” Heard says. “So I’m advising agronomists and farmers to credit it sparingly.”
Schoenau also cautions that most of the nutrients taken up by the crop may not be available for early season growth. “The research on nutrient uptake and recycling shows the importance of soil testing in the fall, especially on those that had significant volunteer growth, and those fields should be checked again in the spring before seeding” Schoenau says. “Especially this year, use every opportunity to retain, recycle and reclaim nutrients on your farm.”
Split application of N may be a good strategy
If spring soil moisture is low, applying part of fertilizer N at or before seeding, followed up with the balance in-crop if moisture conditions improve could be a viable strategy. Research by Guy Lafond at Indian Head, Sask., in the early 2000s compared applying all of the N recommendations at seeding to split applications of 50 to 67 per cent at seeding followed by in-crop application of dribble band UAN (28-0-0).
Under normal growing conditions for wheat, applying 67 per cent of fertilizer N at seeding followed by 33 per cent in-crop yielded the same as applying all of the N at seeding. Similarly, applying 50 per cent of N at seeding to canola followed by the balance in-crop produced the same yield as applying all of the N at seeding.
Karamanos has seen similar results in his research under normal growing conditions. When moisture conditions were above normal, he has seen a yield advantage in canola of up to seven bushels per acre with top dressing. But under dry conditions, there was no benefit.
“Splitting N applications could be an advantage if it remains dry and there is no need for additional N. However, if you split apply, you need to have rain after application to move the N into the rooting zone, and to reduce volatilization losses,” Karamanos says.
Urease inhibitors can be used with UAN or urea to help reduce volatilization losses. Rainfall soon after application, though, is the best insurance against losses.
Timing of split N applications is also important for maximum yield. In-crop application of N to wheat should occur prior to the development of the first node. Applications at the flag leaf stage may contribute to increased protein content. In canola, application should be made before the six-leaf stage to maximize yield.
Settling on phosphorus fertilizer rates
Phosphorus may be one of those nutrients that farmers could consider for reduced fertilizer rates in 2022, depending on the baseline soil fertility. If farmers have been following a maintenance or sufficiency approach to keeping P levels in the soil adequate for crop growth, Karamanos says applying starter P in the seedrow might be all that is needed for 2022. He says research in Alberta found that maximum yield response occurred with the first 20 to 25 pounds P2O5 per acre, and there was a small incremental yield boost up to 40 pounds per acre.
“Even though 65 per cent of soils on the Prairies are below the critical level for P fertility, this might not be the year to worry about applying maintenance levels of P because of the high cost of phosphate fertilizer,” Karamanos says. “Maybe the following year you can go back to applying maintenance levels, but this year I think farmers should be looking for an economic response.”
Both Karamanos and Schoenau caution that immobile P and K should be placed in the seedrow so that they don’t get stranded in dry soil because plant roots can’t grow to them. Schoenau also says that seedrow fertilizer rates should be approached conservatively if soil moisture remains dry at seeding.
Current recommendations are based on seedbed utilization and good soil moisture conditions. For example, with a one inch disc opener on nine inch row spacing, a 11 per cent SBU, the maximum N rate per acre is 10 pounds per acre for canola. Schoenau says that under dry conditions, the salt effect of fertilizer is increased because there is less soil moisture to dilute the salt. Less moisture also means more air-filled pores, and this means that more free ammonia gas from N fertilizer can move further and impact germinating seeds.
Karamanos is also developing a safe seedrow fertilization Excel spreadsheet. Farmers can input various factors such as soil moisture, crop, soil texture and fertilizer type to help guide safe seedrow fertilizer rates. It will also be available at the Alberta Wheat and Barley website.
“If I had to take out some starter nutrients from the seed-row and place them somewhere else because of dry conditions with greater injury potential, I would preferentially take out K and ammonium sulfate because of their greater mobility and leave behind the starter P,” Schoenau says.