Features
Fertilizer
Seed & Chemical
Understanding agronomy research, statistics
Statistics is simply the science of learning from data. For farmers, it is useful to have a basic knowledge of statistics to understand and assess agricultural research results for products or practices that could be used on their farms.
University, government and industry researchers present and discuss their research findings in the print media and at extension meetings. Various practices and products are discussed and promoted, often quoting some type of statistics to prove worthiness.
For any agronomic research study, there are various questions that you should ask:
- Were the trials conducted in a soil and climatic area that is representative of the area you farm? If no trials were conducted within your soil and climatic (agro-ecological) region, there may not be sufficient evidence to draw conclusions for your farm.
- Were the trials conducted at multiple locations each year and repeated for at least three years to develop an understanding of treatment responses with varying conditions? If there was only one research site conducted for one year, this likely would not be sufficient evidence to draw conclusions for your farm.
- Were the trials properly designed and replicated? If a study was simply a strip trial with no replication, or a field split in half and treated differently, then we have little confidence in the trial results. With a field split in two, it is very difficult to determine what factors contributed to the yield increase. There are a number of possible explanations for yield difference such as historical field management differences, natural variation in soil productivity due to soil texture or soil fertility differences, disease pressure or other agronomic factors. When there is no replication in a study, it is almost impossible to reach a definite conclusion as to the causes of crop yield difference.
We must accept that often we cannot obtain the precise information we would like. For example, if we wanted to know the yield benefit of nitrogen fertilizer applied to wheat in the Dark Brown soil zone of the Prairies, it would not be possible to collect data from every farm. Therefore, researchers must make estimates of benefit by conducting research trials on selected farms to represent the entire population of farms in the soil region.
Field research trials provide an estimation of true or real values – this is referred to as statistics. When a series of trials is conducted, intended to be representative of all farms, there will be variation among research sites. The challenge for researchers is how to obtain a representative selection of research sites that are representative of an entire population of farms. It is critically important to place research experiments on sites with uniform soil and topography to minimize variation.
There are various types of agronomic research studies that are conducted. The most common type of agronomic study is the designed field research experiment that uses specific treatments and then observations are made to determine potential benefits. The designed field research experiment is the focus of this article.
Useful statistical terms and definitions
Observations – measurements of outputs of interest such as: crop yield, crop quality (e.g. grain protein), plant stand, disease level, insect infestation, etc., from each treatment.
Treatments – controlled application of a product or practice in an experimental trial such as: seeding rates, fertilizer rates or types, insecticide or fungicide application timing or rates, crop varieties, etc. The treatments are tested to determine impact on crop growth, yield and/or quality. A well-designed experiment will usually have multiple treatments. All treatments in an experiment are grouped into a replicate.
Replicate – to improve the significance of a field experiment, replication or repetition of a group of treatments in an experiment is necessary. If a treatment is truly effective, the averaging effect of replication will reflect potential benefit of a treatment. Replication reduces variability in experimental results, and increases the significance and the confidence level from which a researcher can draw conclusions.
Randomization – in a field experiment, each treatment is randomly assigned within an experimental group or replicate. Randomization of treatments within a replicate is done to prevent potential bias.
Treatment mean – is the average of each treatment observation from each replicate.
Experimental error – this is the natural variation in observations from treatments due to environmental conditions that are beyond the control of the researcher, for example variation within the experimental site such as soil nutrient levels, soil productivity, disease level, insect pressure, etc.
In a field experiment, results can be confounded by variation in soil and environmental factors that leads to experimental error. To determine if differences in observations are due to treatments, we need to know how much experimental error is encountered within an experiment. To account for experimental error, treatments must therefore be replicated. Then, statistics can be used to calculate experimental error.
To ensure the estimate of experimental error for treatments is unbiased, treatments must be placed randomly within each replicate. Ideally, field experiments should have four or more replications. The important lessons here are that to determine experimental error of treatments in field experiments, replication of treatments is necessary; and to ensure the estimate of experimental error is unbiased, randomization of the treatments is required within each replicate.
Researchers will often refer to “statistical significance.” When a field experiment is properly conducted, the experimental error is calculated to determine whether or not treatments differ “significantly” from one another.
Statistics are based on “probabilities.” The first step in statistically analyzing an experiment is conducting an “analysis of variance (AVONA).” From this, researchers will report a probability level, which is referred to as “P” or “p-level” in research reports. Most soil and crop research scientists will use a minimum probability level of 95 per cent or 0.05. When the calculated P level is 0.05, the probability is strong that treatments are “significantly” different. Simply put, a P level of 0.05 probability indicates that 19 times out of 20, the difference among treatments is real. But, it also means there is still a one in 20 chance the difference among treatments is due to chance. A P level of 0.001 (99.9 per cent) probability indicates that 999 times out of 1000, the difference among treatments is real and there is a one in 1000 chance the difference among treatments is due to chance.
A simple interpretation of P values is:
- P ≤ 0.01 – very strong probability of significant difference between treatments
- 0.01 < P ≤ 0.05 – strong probability of significant difference between treatments
- 0.05 < P ≤ 0.1 – lower probability of significant difference between treatments
- P > 0.1 – very low probability of significant difference between treatments
Standard error or SE can be calculated to give an indication of the reliability of the treatment means. A small SE value is an indication the sample mean from an experiment is a more accurate reflection of the actual population mean. As sample size is increased, the SE value is usually smaller.
After determining that a significant difference occurs among treatments, the next step in statistical analysis is determining which treatments are significantly different from each other. Some researchers use “least significant difference” or “LSD” to compare means of different treatments to determine which treatments are statistically different. Many researchers now use more rigorous mean separation tests such as the Tukey or Tukey-Kramer test.
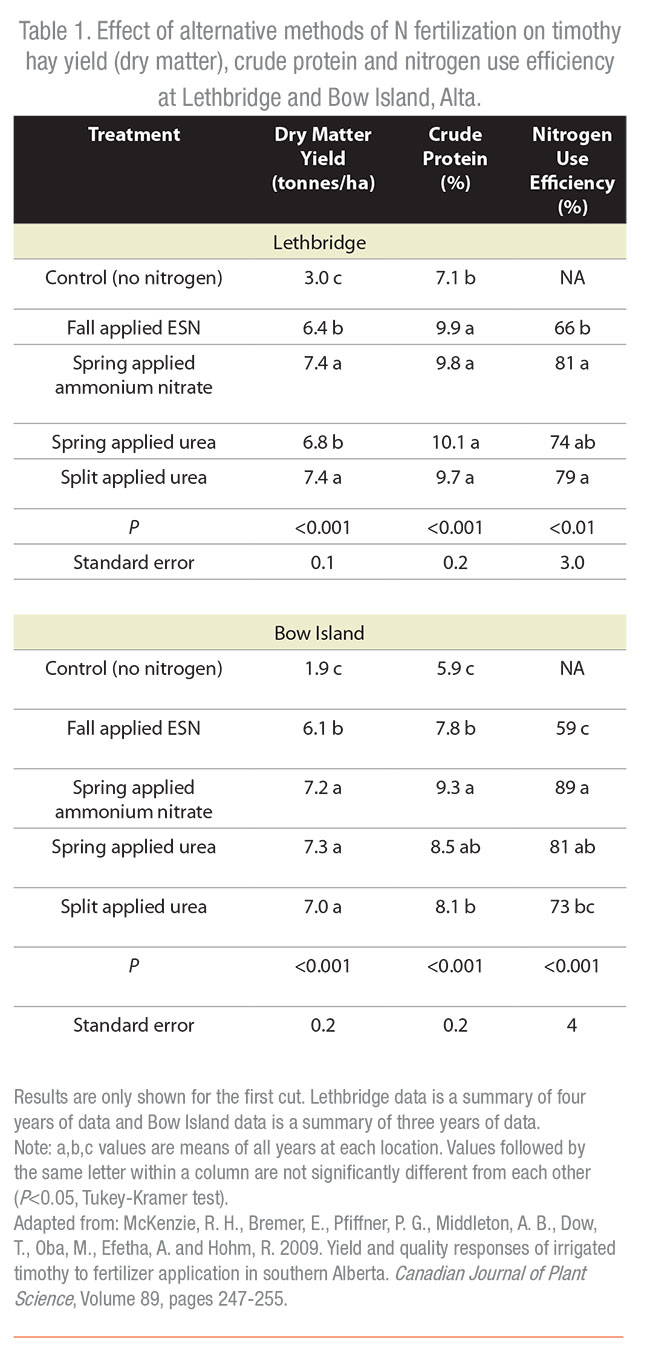
Table 1 is adapted from a larger table from McKenzie et al. (2009), which shows data from a timothy hay fertilizer study, to demonstrate how to interpret statistically analyzed research data. Briefly, Table 1 shows timothy hay response to different nitrogen fertilizer types at two irrigated locations, one at Bow Island for three years and the other at Lethbridge over four years. The left hand column lists nitrogen treatments, including: a check (no
nitrogen applied), fall broadcast ESN, spring broadcast ammonium nitrate, spring broadcast urea, split applied broadcast urea, then P value and standard error.
Observation results are provided for yield (tonnes/ha, dry matter basis), crude protein (%) and nitrogen use efficiency (%). The P value is very highly significant at <0.0001 for yield and crude protein (99.99% level of confidence). The Tukey-Kramer test was used to determine treatment differences for each observation at each site. The observation values are followed by a letter (a, b or c). Values followed by the same letter within a column are not significantly different from each other. At the Lethbridge site, dry matter yield was highest with spring applied ammonium nitrate and split applied urea, as both values are followed by the letter a. At the Bow Island site, the dry matter yield was highest with spring applied ammonium nitrate, spring applied urea and split applied urea, as all values are followed by the letter a. Have a look at the crude protein and nitrogen use efficiency in the other columns and then you decide which fertilizer treatments were most effective. By reviewing data such as this, it provides useful information for farmers to determine which pratice or product would be most likely to provide the greatest benefit in the long term.
Summary
Remember that field research experiments must be properly designed and require multiple treatments, replication and randomization. Properly conducted experiments allow researchers to use statistics to evaluate treatment differences to determine if the differences are due to the applied treatments. Statistics allow meaningful comparisons to help farmers decide what new production practices may or may not beneficial. With a general understanding of statistics, farmers can review and question the validity of research information on new products and practices.
Finally, after reviewing a research report, call or email the researcher with your questions. Most researchers are more than happy to chat with farmers and industry agronomists to ensure their research results are interpreted and used appropriately.
 |
February 18, 2015 By Ross H. McKenzie PhD P. Ag.
 To improve the significance of a field experiment Statistics is simply the science of learning from data.