Features
Agronomy
Fertility and Nutrients
Determining nitrogen fertilizer requirements
N fertilizer rates of 120 vs. 30 kg/ha at a dryland variable rate fertilizer research study. Photo by Ross McKenzie.
Prairie farmers spend more money on nitrogen (N) fertilizer than all other nutrients combined, and agronomists and soil testing labs use various ways to develop N fertilizer recommendations. Careful thought is needed to decide what rates of N fertilizer application will result in optimum yield and quality.
There are four main sources of N for crops:
- Nitrate-N (NO3-N) in soil at the start of the growing season: This is the amount of plant available soil nitrate in the soil at the start of the growing season. It can be determined by soil testing the 0 to 6, 6 to 12 and 12 to 24 inch depths and add up the amounts in pounds per acre for each depth (see Soil sampling and testing – doing it right in the September 2015 issue of Top Crop Manager).
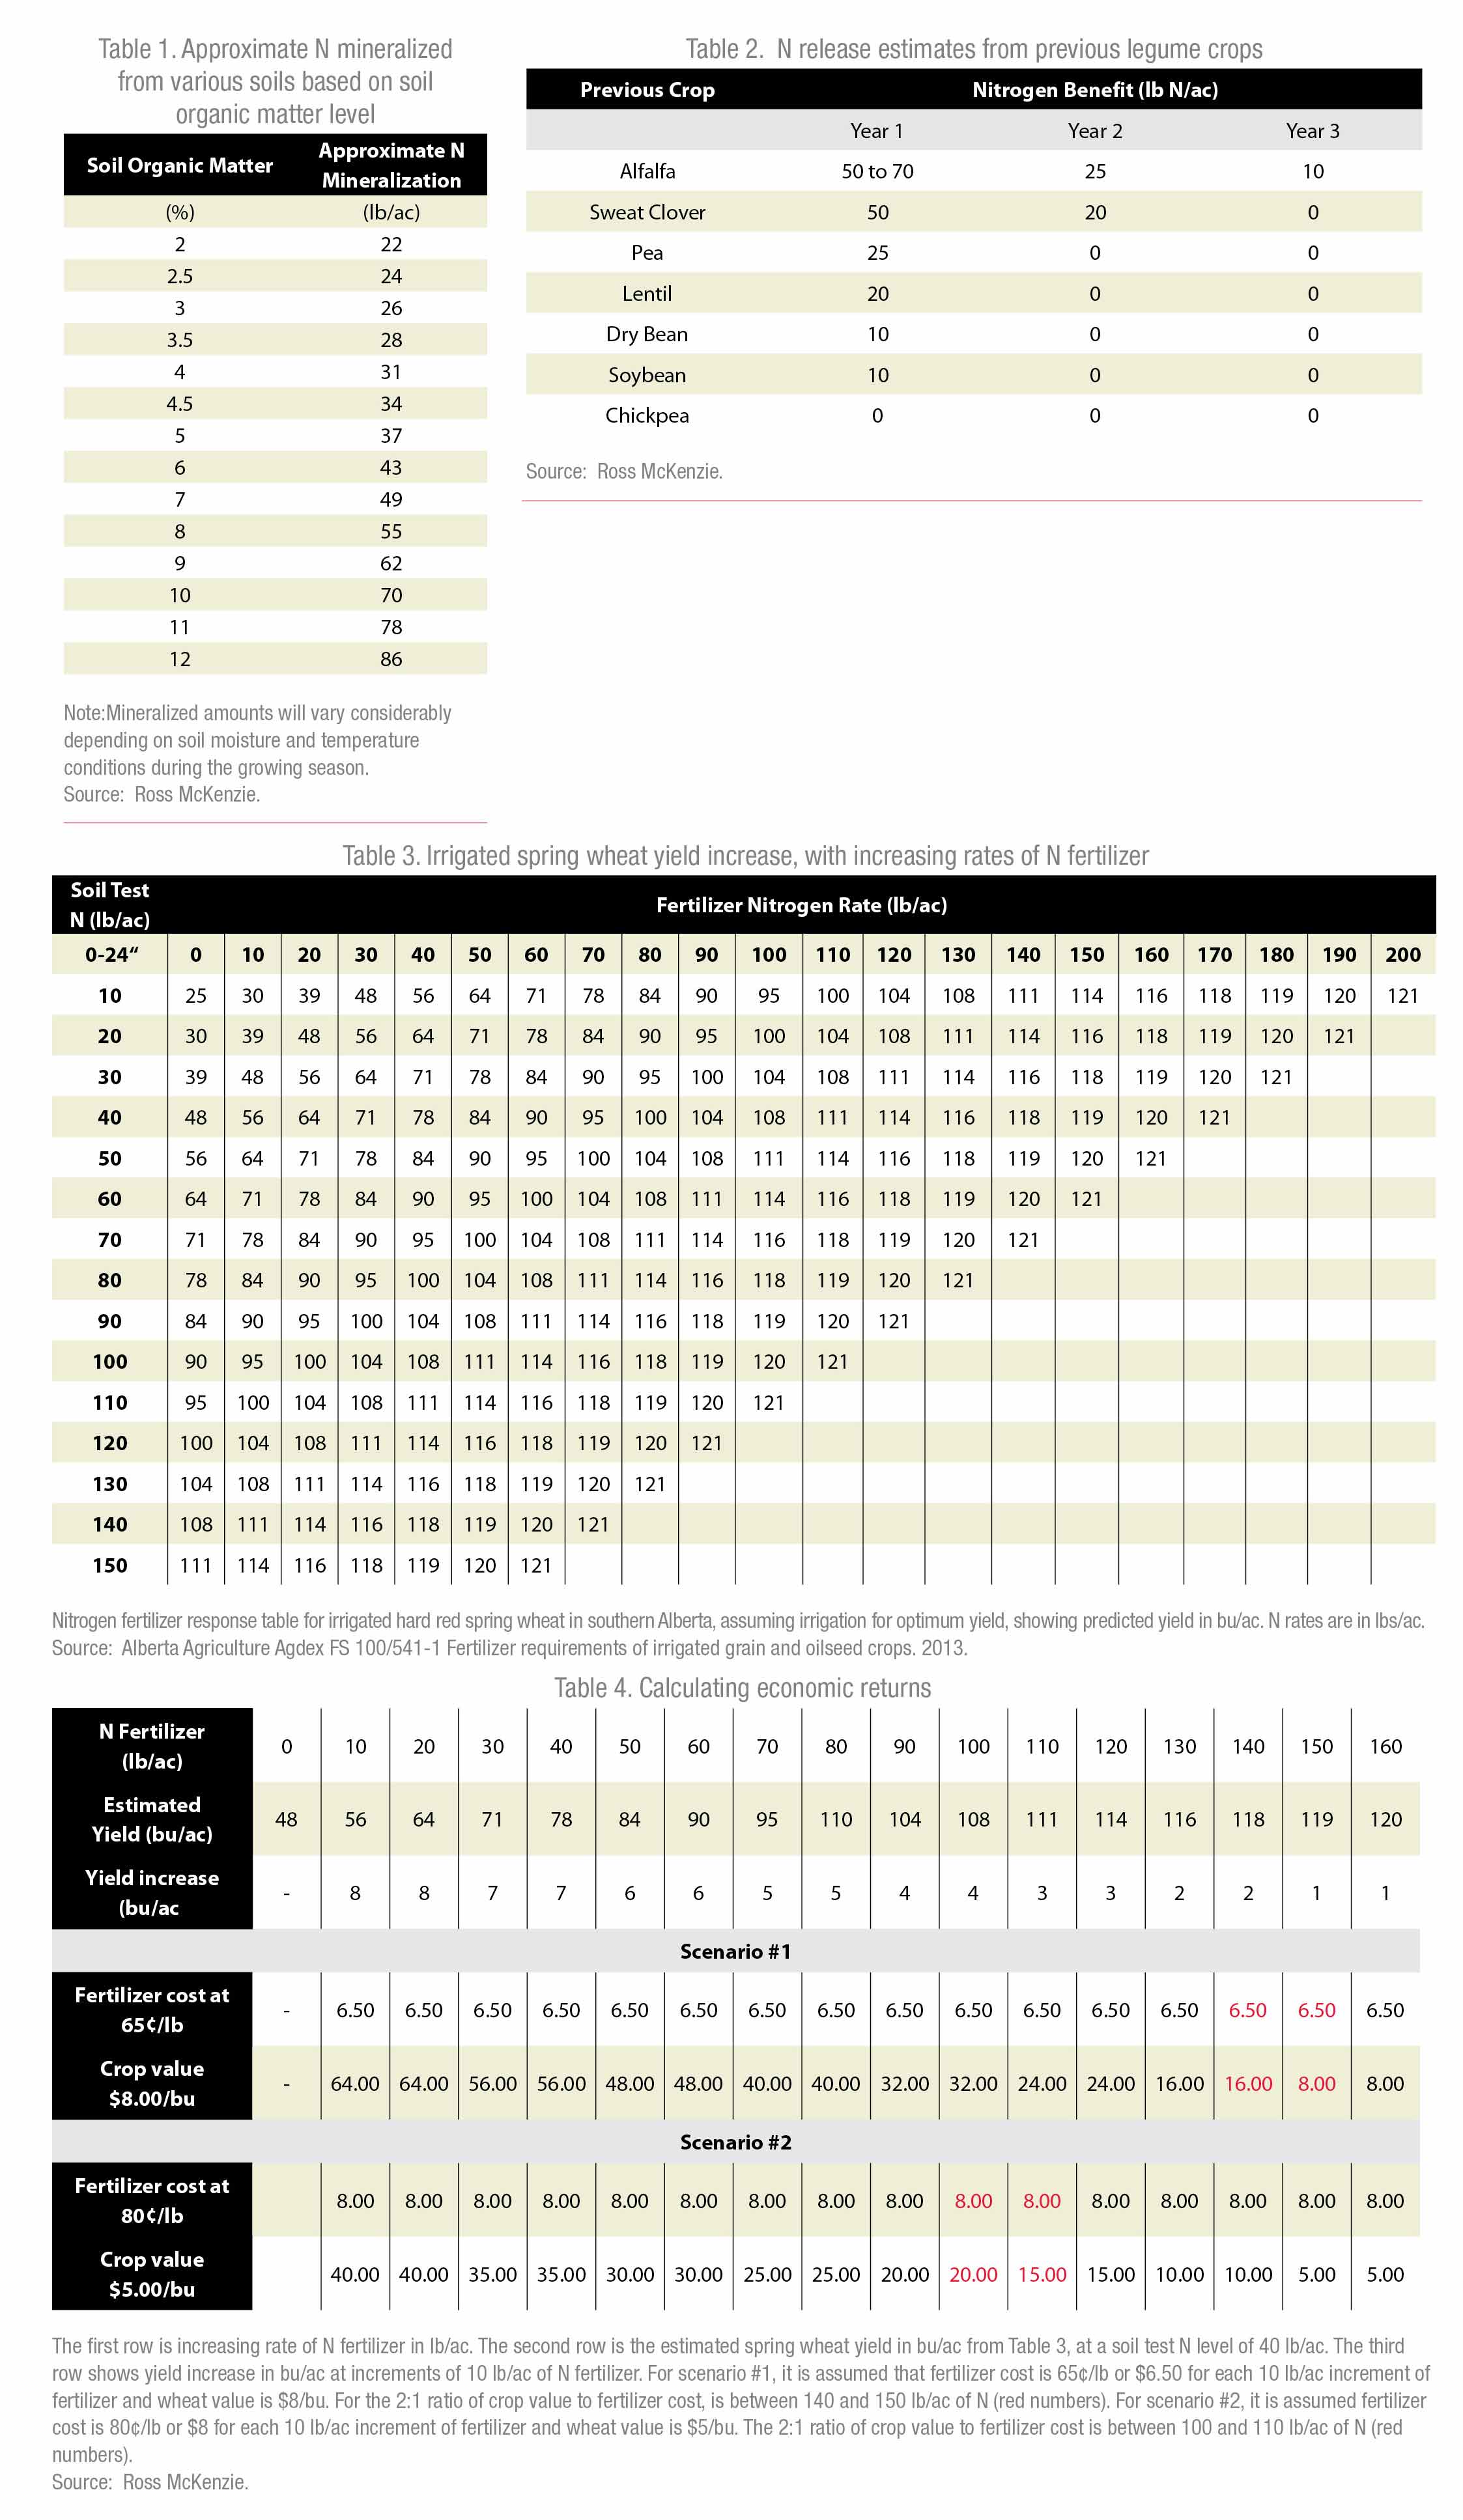
- Nitrogen released from soil organic matter during the growing season: Known as mineralized N, this is the amount of N released from soil organic matter during the growing season. The amount released will depend on soil type, soil organic matter level, soil moisture conditions and soil temperature during the growing season. Table 1 below shows approximate N mineralized from various soils based on soil organic matter level. These numbers can vary significantly, depending on soil environmental conditions from year to year, so it is a challenge to accurately predict. Soil testing to determine the organic matter level of your fields is helpful to make this estimate.
- Nitrogen released from pulse crop residue or livestock manure application: The amount of N released can be quite variable. Table 2 below gives conservative N release estimates from previous legume crops.
- Fertilizer N: Used to supply additional N needed to achieve optimum crop yield.
The starting point to determine N fertilizer requirements is to soil test each field or at least representative fields in late fall for nitrate-N to 24 inches. Also, have the soil testing lab determine soil organic matter level in per cent for surface soil (0 to 6 inch) samples to estimate soil N release during the growing season.
One way to determine N fertilizer requirements is to use a calculation method. Let’s use an example of a farm in the Dark Brown soil zone. For example, soil test a field in late fall that will be seeded to spring wheat next year. The soil test shows 30 lb of N/ac in the top 24 inches and a soil organic matter level of 3.5 per cent. To start the process of estimating N fertilizer required, select a realistic target yield for spring wheat. There is no point in fertilizing for a 100 bu/ac wheat crop if typically there is only enough moisture to grow 40 to 60 bu/ac of wheat.
Spring wheat typically needs four to five inches of water for vegetative growth, and each additional inch of water will contribute 5 to 9 or more bu/ac. In a drier than normal year, yield increase will be about 5 bu/ac per inch of water. In a good average year, it should be about 6 to 7 bu/ac per inch of water and in a wetter than normal year, it can be up to 8 to 9 bu/ac per inch of water or higher. Under optimum pivot irrigation, yield increase can be in the range of 9 to 10 bu/ac per inch of water.
For the purpose of our example, on a dryland farm in a normal year, plan on needing about four inches of water for vegetative growth, with each additional inch of water increasing yield by 6 to 7 bu/ac. Let’s say there are four inches of stored soil moisture going into spring and the average growing season precipitation is about eight inches; then the stored soil moisture will look after vegetative growth and the eight inches of precipitation will go to yield. I would use the assumption spring wheat would produce about 6 to 7 bu/ac per inch of water, so 8 inches of water x 6.5 bu/ac/inch = 52 bu/ac for a target yield. Therefore, I would use a target yield in the range of 50 to 55 bu/ac.
The next step is to multiply the target yield by the amount of N needed to produce a bushel of spring wheat. This value can vary considerably ranging from about 1.7 to 2.4 lb N/bu. Typically when yield is lower, protein level is higher and more N is used per bushel. Conversely, when moisture conditions are very good and yield is higher, protein tends to be a bit lower and less N is used per bushel. For a target yield in the range of 50 to 55 bu/ac, I would multiply 55 bu/ac x 2 lb N/bu = 110 lb of N/ac.
However, we need to consider the soil test N at 30 lb/ac and soil N mineralization from the organic matter, which would be about 28 lb/ac (see Table 1). So from the total N required, subtract the soil test N and estimated N mineralization: 110 lb of N/ac - 30 lb/ac of soil N - 28 lb/ac of mineralized N = 52 lb N/ac.
The estimated N required is about 52 lb/ac. But, soil and fertilizer N are not taken up with 100 per cent efficiency. Hopefully, fertilizer N is taken up at about 60 to 70 per cent efficiency if N is side- or mid-row banded at seeding. There will be some N tie up by soil microbes, and some potential N losses. Therefore, I suggest using an efficiency factor of 70 per cent or slightly lower for the applied fertilizer: 52 lb of N/ac required ÷ 0.7 = 74 lb N/ac.
Using this relatively simple method, about 70 to 75 lb/ac of N fertilizer is required (I use rounded numbers as this is an estimated calculation). This is a calculated estimate and it does not take into account the value of spring wheat or the cost of the N fertilizer.
Another way to estimate N fertilizer is to use regional N fertilizer response curves, if they are available for your region. Crop yield response curves conducted on typical soils and crops in your region are really the best way to estimate how much N fertilizer is needed. And, you can do some economic analysis. There has been N fertilizer research across Alberta in the past, to develop and maintain N response curves in the various soil and climatic regions of the province. Table 3 shows irrigated spring wheat yield increase, with increasing rates of N fertilizer. (This work was done by Alberta Agriculture from 2006 to 2011.)
In addition, Table 4 (below) uses information from Table 3 (below) to calculate the economic return using two scenarios when soil test N is 40 lb/ac in the 0 to 24 inch depth. Rather than look at a predicted yield, this method looks at “predicted yield increase” with increasing N fertilizer rates. In Scenario 1, about 140 to 150 lb/ac of N would be economical, and in Scenario 2, about 100 to 110 lb/ac of N would be economical. In both scenarios, the soil test N level is the same and the same crop is grown; the difference in N fertilizer required is based on N fertilizer price and value of the crop. We don’t worry about soil N mineralization here, as this is built into the N fertilizer response curve information.
For Alberta farmers, a program called Alberta Farm Fertilizer Information Recommendation Manager (AFFIRM) was developed with all available N fertilizer response curves for the various agro-ecological areas of the province. The program allows the user to input soil test results, crop value and fertilizer costs to easily calculate economic N rates using different scenarios.
Using up-to-date regional nitrogen yield increase information to economically determine the optimum N fertilizer required is really the best approach. However, many areas of the Prairies do not have current, up-to-date response information. Unfortunately, this type of research just isn’t being done anymore across the Prairies. So many farmers must determine N fertilizer requirements using a more simplistic calculation method.
The big unknown every year is the environmental conditions that will occur during the growing season, after most or all of the N fertilizer is applied. We don’t know ahead of time if we will have a wetter, drier or near normal year. Therefore, I suggest being cautiously optimistic and fertilize for a reasonably good target yield each year.
 |
January 14, 2016 By Ross H. McKenzie PhD P.Ag.