Features
Diseases
A harmonized clubroot map for the Prairies
Presenting clubroot distribution data in a more consistent and informative way to improve disease management.
July 30, 2020 By Donna Fleury
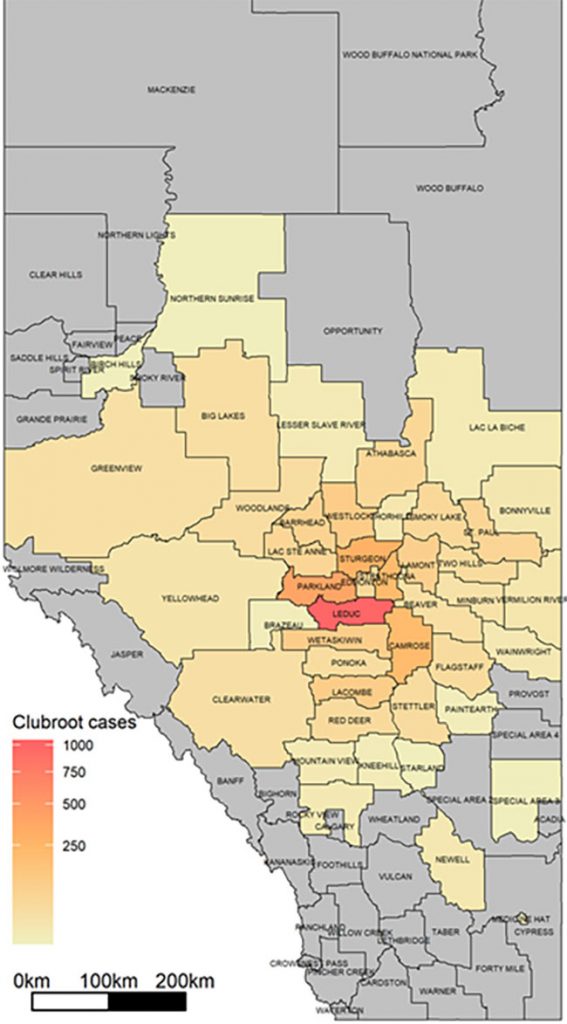 This variant of the Alberta clubroot map shows the number of confirmed cases across counties as a continuous gradient, with color becoming darker as cases increase. No clubroot has been confirmed in areas shown in grey. Photo courtesy of Y. Aigu and S.E. Strelkov, University of Alberta.
Clubroot in canola continues to spread across the Canadian Prairies, with its distribution and intensity across many areas of Alberta, and more recently in fields in Saskatchewan and Manitoba. Clubroot was first identified in Alberta canola fields in 2003. As of the end of 2019, more than 3,300 clubroot-infested fields have been confirmed in Western Canada, the majority of which are located in central Alberta.
Research, surveillance and monitoring data continue to be collected on this challenging and costly disease, but researchers and industry are still trying to determine the most effective way to present and utilize this data in management plans.
“We are working on a project funded by the canola grower associations across the Prairies to try to determine new ways to present clubroot distribution data,” explains Stephen Strelkov, professor of plant pathology at the University of Alberta. “It is important to understand not only the distribution of clubroot disease, but also to be able to track and monitor the disease severity and intensity across the growing areas.
“We also know that clubroot doesn’t stop at a county or provincial border, so finding a way to present the information more consistently will be helpful for managing the disease.”
The objective of this two-year project is to examine the feasibility of a harmonized clubroot map and to determine what such a map will look like. A number of different strategies are currently being used to present data on clubroot across Western Canada, which can be challenging and may cause confusion. Some maps present data on clubroot occurrence and distribution by showing field locations where diseased canola plants have been found, while other maps show soil testing results and spore density. Map colouring schemes can also vary across provinces, potentially causing confusion.
“We are exploring different ways to present the data in the clearest and most informative ways on the occurrence and distribution of clubroot, intensity, and also in formats that can show and track dynamic changes in the disease data over time,” Strelkov says. “For example, a map showing cases as discrete points at a high-level scale can show disease occurrence. However, we also have to consider the sensitivity to the level of detail that is made available.
“Some maps show the location of fields with confirmed clubroot as one colour, while fields where clubroot was not found are shown as another. Other maps have been designed in which clubroot distribution is illustrated based on the total number of confirmed infestations in a municipality. A more recent map we developed expresses infestation as a percentage of total farmed acreage in a county or municipality in order to compare the degree of infestation across regions. Some maps use a scale or gradient for total number of fields or infestations, but the data can get blurred at county or provincial boundary changes, adding to confusion,” Strelkov explains.
“We aren’t sure which strategy is best, but a more consistent presentation and one that provides an easily interpreted scale or gradation would likely be more informative.”
Strelkov would also like to find ways to track over time how the disease and Plasmodiophora brassicae pathogen distribution may change. A map may be able to show the most common pathotypes in an area, and perhaps areas where new pathotypes are being confirmed. For example, pathotypes 3A, 3D and 3H are currently the most common and each could be highlighted with specific colours, while other rarer pathotypes could be identified as “other” with a different colour. This would provide a quick visual of the more common pathotypes in an area and an awareness of the distribution of other pathotypes or new pathotypes if they develop.
One of the tools to help with tracking the pathogen distribution is the Canadian Clubroot Differential (CCD) Set recently developed by Strelkov and his colleagues. The CCD Set represents an improved system for the identification of new virulence profiles of P. brassicae and their classification into pathotypes. The resulting CCD Set has a greater differentiating capacity than the systems that were previously in use, and has allowed the identification of many new pathotypes of P. brassicae that would have otherwise gone undetected.
From 2014 to 2016, for example, the virulence of 151 P. brassicae populations was tested on a suite of clubroot-resistant (CR) canola cultivars, representing one club from each field in which clubroot was found on a CR canola crop. Surveys conducted from 2014 to 2016 identified a total of 17 known pathotypes in Canada, including at least 11 of which can break resistance in CR canola (and five of which are the original “old” ones).
“We have shared preliminary results with the Clubroot Steering Committee and other stakeholders and are using their feedback to further refine the maps,” Strelkov says. “The maps will be developed for Western Canada as we move forward, but implementation may vary depending on stakeholder needs. We expect that a more standard way of reporting the range, severity and distribution will help in developing management strategies.
“Growers are encouraged to continue to use best practices, best cultivars and recommended rotations of at least two years of other crops between canola. Although clubroot resistance is still highly effective in the majority of fields, recent surveys show that there are more than 300 fields, nearly all in Alberta, where resistance issues have been observed,” Strelkov notes.
“Growers should continue to deploy resistant varieties and use resistance stewardship best practices as we try to balance clubroot resistance with evolving pathogen strains and virulence. This integrated approach, combined with a more consistent mapping strategy and dynamic disease and pathogen tracking methods, will help growers and industry implement a more sustainable clubroot management strategy.”