Features
Business & Policy
Business Management
Our Prairie weather
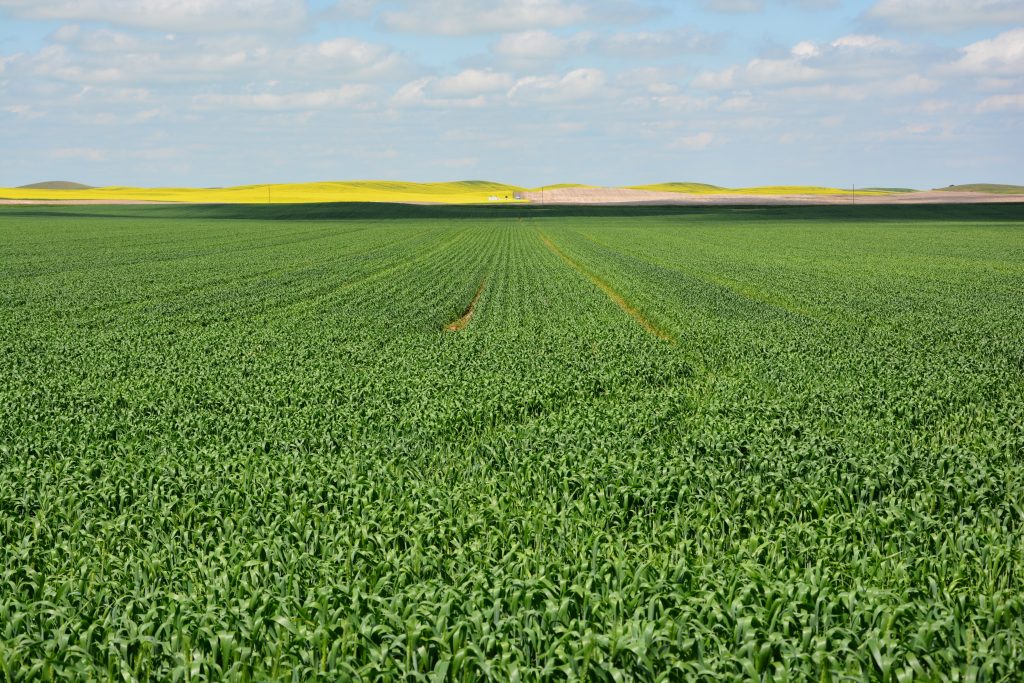
Weather factors including moisture availability, temperature and solar radiation affect crop yield potential. Photo by Janet Kanters.
Plants require a specific amount of heat and water to develop from one point in their life cycle to another. Unexpected events such as a late season spring frost, early fall frost, extended saturating rain and hail are just some of the weather factors farmers must frequently contend with.
July 6, 2016 By Ross H. McKenzie PhD P. Ag.
 Weather factors including moisture availability
 So too weather influences the life cycle of many insects that can affect insect pressure and damage to crops. Weather also influences disease pressure and crop disease levels. The bottom line – weather has huge direct and indirect effects on crop growth, yield and quality.
As farmers and crop research scientists develop a better understanding of the effects of weather and climate on crop production, more informed crop management strategies can be developed. And as meteorologists improve their accuracy to predict weather, this will further aid farmers in making crop management decisions.
Farmers need to be familiar with and understand basic crop-related weather terms:
Weather is the short-term condition of the atmosphere at a specific place and time, such as temperature, dryness, sunshine, wind, rain, etc.
Climate is the average weather for many years or accumulation of daily and seasonal weather events over a long period of time. It is the sum of all statistical weather information that helps describe a specific place or region.
Growing season is the period of time in a year when the climate is suitable for cultivated plants to experience growth. Growing season length is usually determined by the number of consecutive frost-free days.
Growing season precipitation is the total amount of rainfall received from planting to maturity.
Growing degree days (GDD) is a measure of accumulated heat used to predict crop growth stages. GDD are calculated by taking the average of the daily maximum and minimum temperatures and subtracting a base temperature using the formula:

Each degree that a day’s mean temperature is above a reference temperature is counted as one degree-day. Base temperature used is usually 0, 5 or 7 C depending on the crop.
Corn Heat Units (CHU) is also a measure of accumulated heat, using a more complex temperature formula than the formula used for GDD, and is used to determine the amount of heat needed by corn or soybean to reach maturity in Western Canada.
Frost injury occurs when ice forms inside plant tissue and damages plant cells. Frost injury can affect the entire plant or a specific part of plant tissue, which reduces yield or quality. Knowing the probability of frost occurrence in spring and fall is important. A light frost of 0 to -1.5 C will kill sensitive plants such as beans at emergence but has no effect on cereal crops at emergence. Moderate frost of -1.5 to -4.0 C has little effect on cereal crops at emergence but has a destructive effect on cereal or oilseed crops at flowering or grain filling.
Evapotranspiration is the combination of vaporization of water directly from the soil surface and release of water vapour by transpiration from vegetation, and is used to determine
water use by crops on a daily and seasonal basis.
Solar radiation is the energy from the sun that provides light and heat required for seed germination, leaf expansion, growth of stems and shoots, flowering, fruiting and thermal conditions necessary for the physiological functions of the plant.
Probability is the prediction of the likelihood of an occurrence of a specific weather condition (e.g. probability of frost event).
Collectively, weather factors including moisture availability, temperature and solar radiation and many other factors affect crop yield potential. As weather factors vary from year to year, so does crop yield potential.
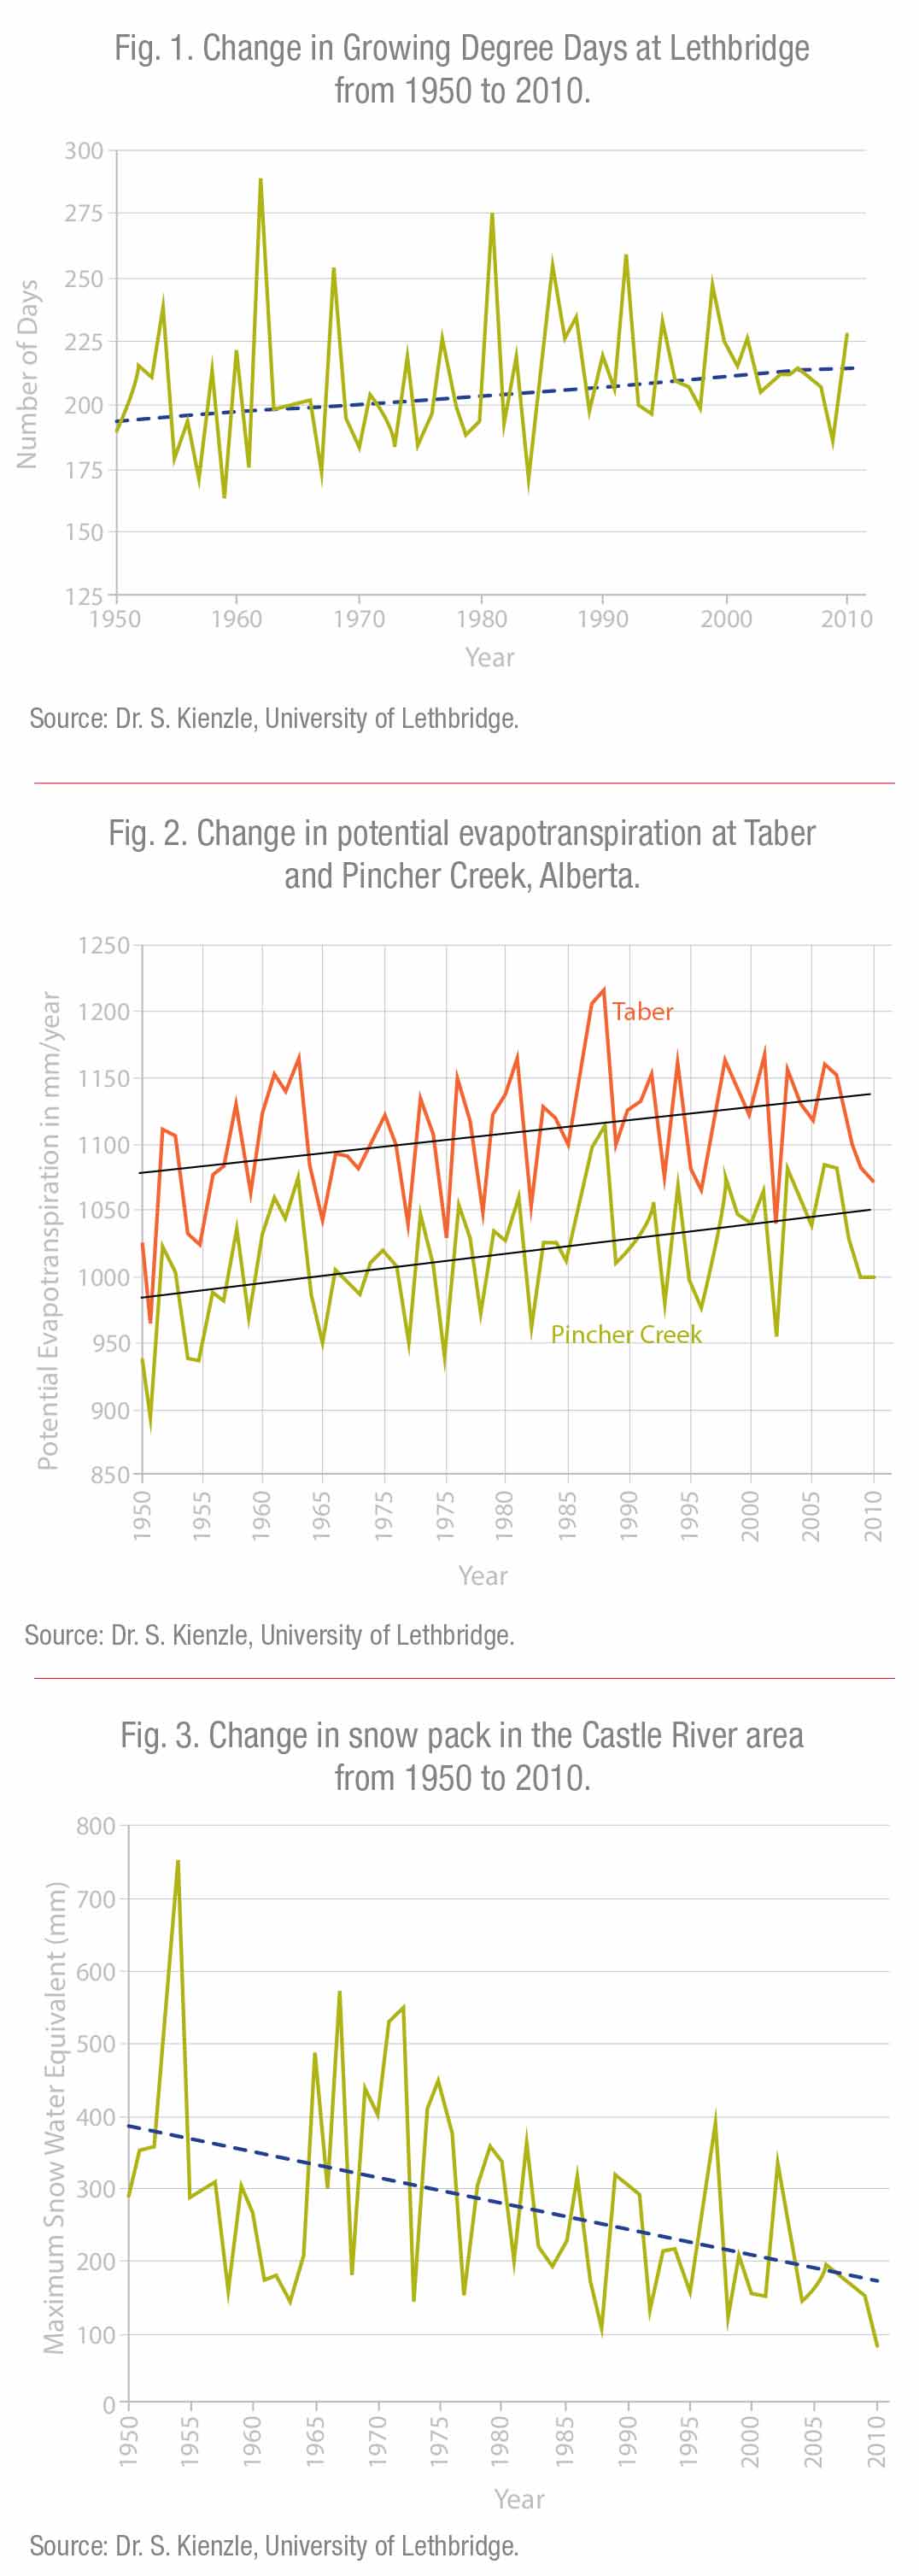
In recent years various media have reported on climate and how it is changing. A research study conducted by Stefan Kienzle and co-workers at the University of Lethbridge (U of L) examined all weather records in Alberta from 1950 to 2010 to determine if there were any significant climate change trends over the past 60 years. Their work showed that at Lethbridge, the growing season length increased from 193 to 214 days from 1950 to 2010, an increase of 21 days. At Edmonton and Grande Prairie the growing season increased by 11 and 22 days, respectively.
The U of L group looked at the total number of days per year with a maximum temperature of 25 C or more. At Lethbridge, the number of days increased from 54 to 61, an increase of seven days. At Edmonton and Grande Prairie, the number of days increased by 13 and eight days, respectively.
Heat wave periods were evaluated. They defined heat wave as when the average daily temperature is 5 C or more above average, for at least five consecutive days. At Lethbridge, heat wave days increased from 20 to 39, an increase of 19 days. At Edmonton and Grande Prairie, heat wave days increased by 21 and 20 days, respectively.
Kienzle’s research study has shown that the length of growing season and the number of days over 25 C have increased across most of Alberta. This is good news for Prairie farmers: more heat equals a longer growing season for crops, which in turn means crops are able to capture more radiant sun energy if seeded earlier, thus increasing crop yield potential. A longer growing season also reduces the risk of early season frost injury at crop maturity, and it increases the potential to grow new crops that require a longer growing season.
The down side is that with a warmer growing season, the potential evapotranspiration of crops is also increased. This means that crops may require more water to produce the same yield due to increased transpiration. Fig. 2 shows examples of increased potential evapotranspiration at two southern Alberta locations at Pincher Creek and Taber.
A concern looking forward is the effect of climate on snow pack in the mountains and potential water availability for irrigation farmers and water flow in rivers in spring and summer. Fig. 3 shows the trend of snow pack in the Castle River region west of Pincher Creek. This is a tributary of the Oldman River and ultimately the South Saskatchewan River. If snow pack is gradually reduced each winter, this will reduce water available for irrigation across the Prairies.
Of greatest interest will be the trend for stored soil moisture in spring and average growing season precipitation. If the growing season precipitation trend is upward in the future, that will be good news for Prairie farmers for increased crop yield potential. However, if the trend is reduced precipitation and increased heat waves, this will mean Prairie farmers will have to adapt to more water use efficient crops and crops with greater drought tolerance.
Careful observation of weather and climate trends in the future will become increasingly important for Prairie farmers and crop research scientists to adapt crops, crop rotations and crop management strategies to ensure optimum crop production.
The U of L group has developed an interactive Alberta map to show a number of weather variables and provide trend lines for each weather variable: www.albertaclimaterecords.com.